. 2002 Feb 19;99 Suppl 1(Suppl 1):2466-72.
doi: 10.1073/pnas.012579499.

Fractal dynamics in physiology: alterations with disease and aging

Affiliations

Fractal dynamics in physiology: alterations with disease and aging

Ary L Goldberger et al. Proc Natl Acad Sci U S A. .

Abstract

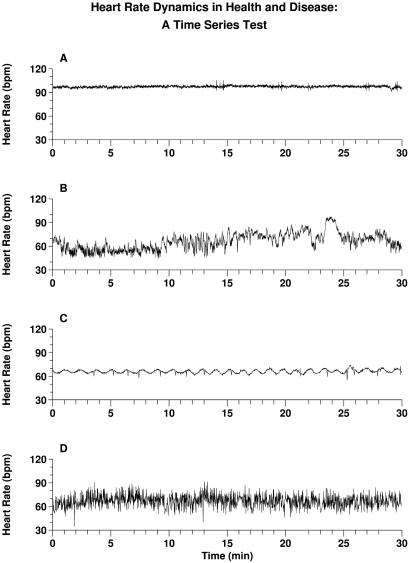
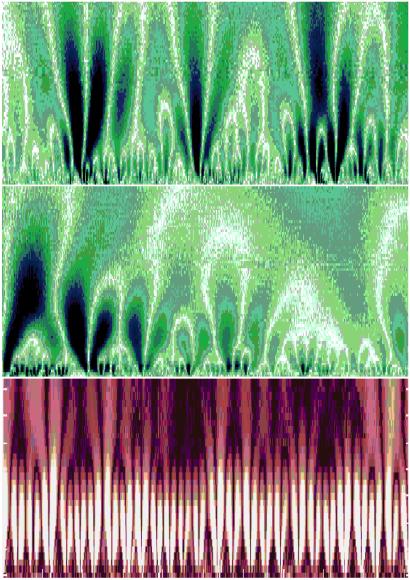
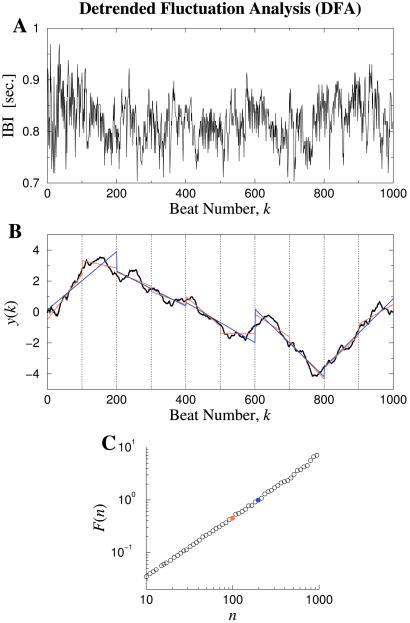
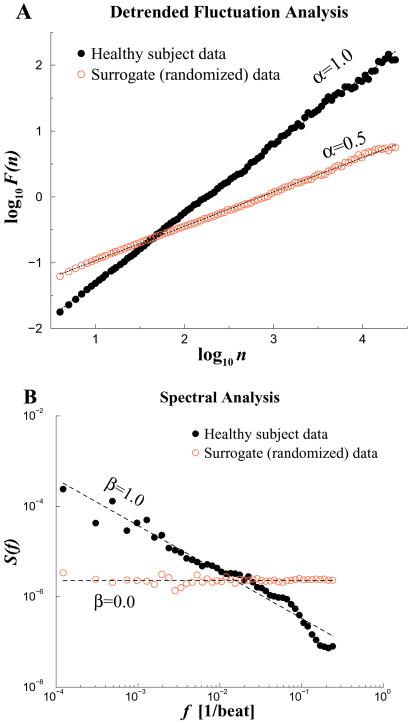
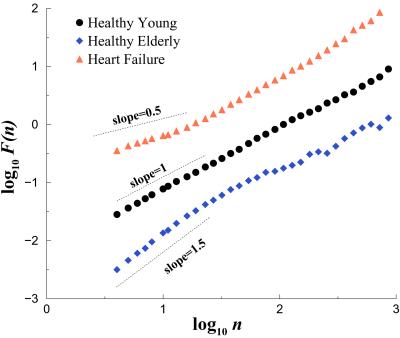
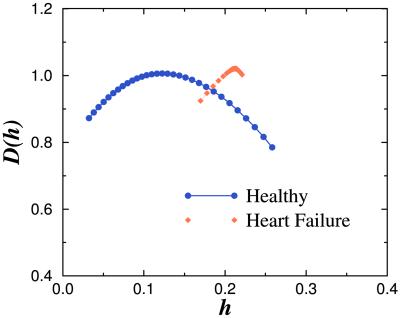
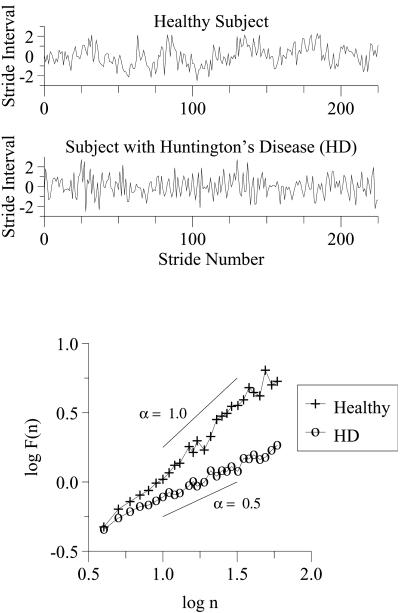
According to classical concepts of physiologic control, healthy systems are self-regulated to reduce variability and maintain physiologic constancy. Contrary to the predictions of homeostasis, however, the output of a wide variety of systems, such as the normal human heartbeat, fluctuates in a complex manner, even under resting conditions. Scaling techniques adapted from statistical physics reveal the presence of long-range, power-law correlations, as part of multifractal cascades operating over a wide range of time scales. These scaling properties suggest that the nonlinear regulatory systems are operating far from equilibrium, and that maintaining constancy is not the goal of physiologic control. In contrast, for subjects at high risk of sudden death (including those with heart failure), fractal organization, along with certain nonlinear interactions, breaks down. Application of fractal analysis may provide new approaches to assessing cardiac risk and forecasting sudden cardiac death, as well as to monitoring the aging process. Similar approaches show promise in assessing other regulatory systems, such as human gait control in health and disease. Elucidating the fractal and nonlinear mechanisms involved in physiologic control and complex signaling networks is emerging as a major challenge in the postgenomic era.


Figures

Fig 1.
Fig 1.
Representative heart rate recordings in health and disease, presented as four unknowns. One record is normal; the other three represent severe pathologies. Can you identify which is normal? Answers: A and C are from patients in sinus rhythm with severe congestive heart failure. D is from a subject with a cardiac arrhythmia, atrial fibrillation, which produces an erratic heart rate. The healthy record, B, far from a homeostatic constant state, is notable for its visually apparent nonstationarity and “patchiness.” These features are related to fractal and nonlinear properties. Their breakdown in disease may be associated with the emergence of excessive regularity (A) and (C), or uncorrelated randomness (D). Of note in C is the presence of strongly periodic oscillations (≈1/min), which are associated with Cheyne-Stokes breathing, a pathologic type of cyclic respiratory pattern. Quantifying and modeling the complexity of healthy variability, and detecting more subtle alterations with disease and aging, present major challenges in contemporary biomedicine.
Fig 2.
Fig 2.
Schematic representations of self-similar structures and self-similar fluctuations. The tree-like, spatial fractal (Left) has self-similar branchings, such that the small-scale structure resembles the large-scale form. A fractal temporal process, such as healthy heart rate regulation (Right), may generate fluctuations on different time scales that are statistically self-similar. Adapted from ref. .
Fig 3.
Fig 3.
(Top) Color-coded wavelet analysis of a heart rate time series in health. The x axis represents time (≈1700 beats), and the y axis indicates the wavelet scale, extending from about 5 to 300 s, with large time scales at the top. The brighter colors indicate larger values of the wavelet amplitudes, corresponding to large heartbeat fluctuations. White tracks represent the wavelet transform maxima lines—the structure of these maxima lines shows the evolution of the heartbeat fluctuations with scale and time. This wavelet decomposition reveals a tree-like, self-similar hierarchy to the healthy cardiac dynamics. (Middle) Magnification of the central portion of the top panel, with 200 beats on the x axis and wavelet scale corresponding to about 5 to 75 s on the y axis, shows similar branching patterns. (Bottom) In contrast, wavelet decomposition of heartbeat intervals (≈1500 beats) from a patient with obstructive sleep apnea, a common pathologic condition, shows the loss of complex, multiscale hierarchy, with emergent, single-scale (periodic) behavior. The wavelet scale (along the y axis) extends from about 5 to 200 s. The red background is used to provide contrast with the fractal cascades under healthy conditions, shown in the Upper panels. Adapted from ref. .
Fig 4.
Fig 4.
Illustration of the DFA algorithm to test for scale-invariance and long-range correlations. (A) Interbeat interval (IBI) time series from a healthy young adult. (B) The solid black curve is the integrated time series, y(k). The vertical dotted lines indicate boxes of size n = 100 beats. The red straight line segments represent the “trend” estimated in each box by a linear least-squares fit. The blue straight line segments represent linear fits for box size n = 200. Note that the typical deviation from the y(k) curve to the red lines is smaller than the deviation to the blue lines. (C) The rms deviations, F(n), in B are plotted against the box size, n, in a double logarithmic plot. The red circle is the data point for F(100), and the blue circle is the data point for F(200). A straight-line graph indicates power-law scaling. The slope of the line, α, relates to the presence and type of two-point correlations. In this case, α ≃ 1.0, consistent with 1/f noise and long-range correlations; α = 0.5 indicates white noise with uncorrelated randomness; α = 1.5 indicates Brownian noise. See Figs. 5–7 and text. Adapted from ref. .
Fig 5.
Fig 5.
Fractal scaling analyses for two 24-hr interbeat interval time series. The solid black circles represent data from a healthy subject, whereas the open red circles are for the artificial time series generated by randomizing the sequential order of data points in the original time series. (A) Plot of log F(n) vs. log n by the DFA analysis. (B) Fourier power spectrum analysis. The spectra have been smoothed (binned) to reduce scatter. DFA and Fourier scaling exponents, α ≃ 1.0 and β ≃ 1.0, respectively, are consistent with long-range correlations (1/f noise). After randomization, α ≃ 0.5 and β ≃ 0, consistent with loss of correlation properties (white noise).
Fig 6.
Fig 6.
Scaling analysis of heartbeat time series in health, aging, and disease. Plot of log F(n) vs. log n for data from a healthy young adult, a healthy elderly subject, and a subject with congestive heart failure. Compared with the healthy young subject, the heart failure and healthy elderly subjects show alterations in both short and longer range correlation properties. To facilitate assessment of these scaling differences, the plots are vertically offset from each other. Adapted from ref. .
Fig 7.
Fig 7.
Singularity spectra of heart rate signals in health and disease. The function D(h) measures the fractal dimension of the subset of the signal that is characterized by a local Hurst exponent with value h. (The local Hurst exponent h is related to the exponent α of the DFA method by the relationship α = 1 + h.) Note the broad range of values of h with non-zero fractal dimensions for the healthy heartbeat, indicating multifractal dynamics. In contrast, data from a representative subject with severe heart failure shows a much narrower range of values of h with non-zero fractal dimensions, indicating loss of multifractal complexity with a life-threatening disease. Adapted from ref. .
Fig 8.
Fig 8.
Stride interval fluctuations in health and disease. For illustrative purposes, each time series has been normalized by subtracting its mean and dividing by its standard deviation. The breakdown in long-range correlations with Huntington's disease is indicated by the change in scaling exponent, α, from close to 1 in health to about 0.5 with severe pathology. Logarithmic values are given to base 10. Adapted from ref. .

References

    1. Walleczek J., (1999) Nonlinear Dynamics, Self-Organization, and Biomedicine (Cambridge Univ. Press, Cambridge, U.K.).
    1. Goldberger A. L. (2001) Am. J. Respir. Crit. Care Med. 163, 1289-1290. - PubMed
    1. Bassingthwaighte J. B., Liebovitch, L. S. & West, B.J., (1994) Fractal Physiology (Oxford Univ. Press, New York).
    1. Winfree A. T. (1994) Nature (London) 371, 233-236. - PubMed
    1. Glass L. & Mackey, M. C., (1988) From Clocks to Chaos: the Rhythms of Life (Princeton Univ. Press, Princeton).

Publication types