

Allometric scaling of metabolic rate from molecules and mitochondria to cells and mammals
- PMID: 11875197
- PMCID: PMC128563
- DOI: 10.1073/pnas.012579799
Allometric scaling of metabolic rate from molecules and mitochondria to cells and mammals
Abstract
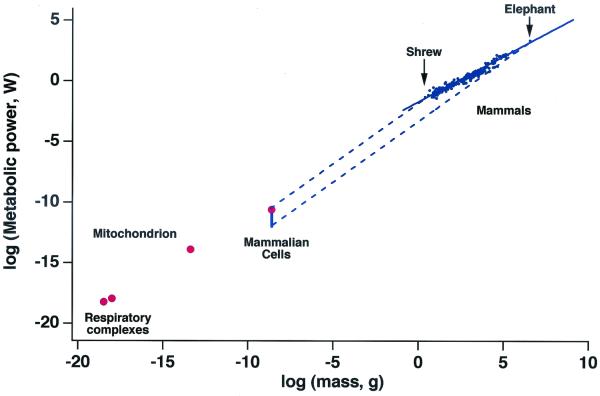
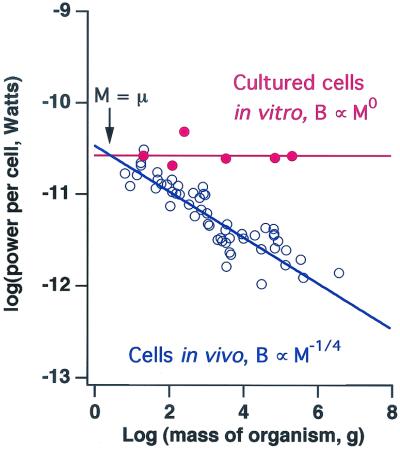
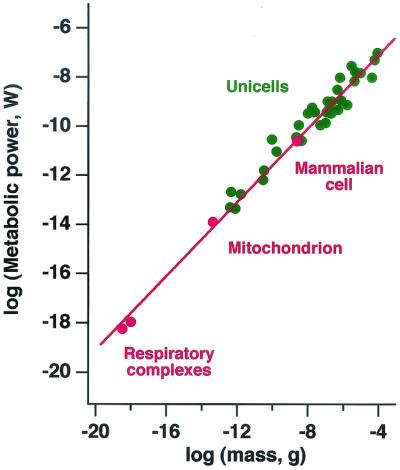
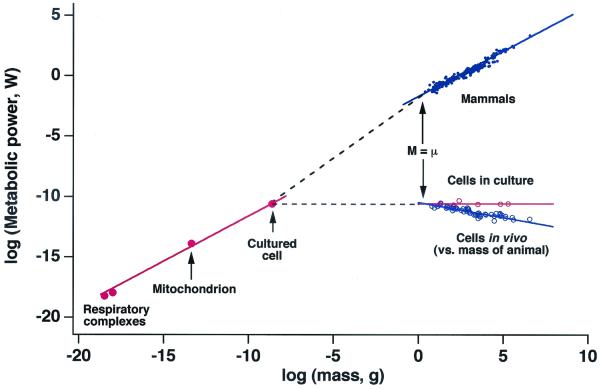
The fact that metabolic rate scales as the three-quarter power of body mass (M) in unicellular, as well as multicellular, organisms suggests that the same principles of biological design operate at multiple levels of organization. We use the framework of a general model of fractal-like distribution networks together with data on energy transformation in mammals to analyze and predict allometric scaling of aerobic metabolism over a remarkable 27 orders of magnitude in mass encompassing four levels of organization: individual organisms, single cells, intact mitochondria, and enzyme molecules. We show that, whereas rates of cellular metabolism in vivo scale as M(-1/4), rates for cells in culture converge to a single predicted value for all mammals regardless of size. Furthermore, a single three-quarter power allometric scaling law characterizes the basal metabolic rates of isolated mammalian cells, mitochondria, and molecules of the respiratory complex; this overlaps with and is indistinguishable from the scaling relationship for unicellular organisms. This observation suggests that aerobic energy transformation at all levels of biological organization is limited by the transport of materials through hierarchical fractal-like networks with the properties specified by the model. We show how the mass of the smallest mammal can be calculated (approximately 1 g), and the observed numbers and densities of mitochondria and respiratory complexes in mammalian cells can be understood. Extending theoretical and empirical analyses of scaling to suborganismal levels potentially has important implications for cellular structure and function as well as for the metabolic basis of aging.
Figures
Similar articles
-
Heterogeneity of cells may explain allometric scaling of metabolic rate.Biosystems. 2015 Apr;130:11-6. doi: 10.1016/j.biosystems.2015.02.003. Epub 2015 Feb 7. Biosystems. 2015. PMID: 25668408
-
Exercise-induced maximal metabolic rate scales with muscle aerobic capacity.J Exp Biol. 2005 May;208(Pt 9):1635-44. doi: 10.1242/jeb.01548. J Exp Biol. 2005. PMID: 15855395 Review.
-
Testing the metabolic theory of ecology: allometric scaling exponents in mammals.Ecology. 2007 Feb;88(2):324-33. doi: 10.1890/0012-9658(2007)88[324:ttmtoe]2.0.co;2. Ecology. 2007. PMID: 17479751
-
Multi-level regulation and metabolic scaling.J Exp Biol. 2005 May;208(Pt 9):1627-34. doi: 10.1242/jeb.01503. J Exp Biol. 2005. PMID: 15855394 Review.
-
Allometric scaling of maximal metabolic rate in mammals: muscle aerobic capacity as determinant factor.Respir Physiol Neurobiol. 2004 May 20;140(2):115-32. doi: 10.1016/j.resp.2004.01.006. Respir Physiol Neurobiol. 2004. PMID: 15134660 Review.
Cited by
-
Mass measurements during lymphocytic leukemia cell polyploidization decouple cell cycle- and cell size-dependent growth.Proc Natl Acad Sci U S A. 2020 Jul 7;117(27):15659-15665. doi: 10.1073/pnas.1922197117. Epub 2020 Jun 24. Proc Natl Acad Sci U S A. 2020. PMID: 32581119 Free PMC article.
-
Evolutionary scaling of maximum growth rate with organism size.Sci Rep. 2022 Dec 30;12(1):22586. doi: 10.1038/s41598-022-23626-7. Sci Rep. 2022. PMID: 36585440 Free PMC article.
-
Why bears hibernate? Redefining the scaling energetics of hibernation.Proc Biol Sci. 2022 Apr 27;289(1973):20220456. doi: 10.1098/rspb.2022.0456. Epub 2022 Apr 27. Proc Biol Sci. 2022. PMID: 35473385 Free PMC article.
-
Short- and long-term consequences of heat exposure on mitochondrial metabolism in zebra finches (Taeniopygia castanotis).Oecologia. 2023 Mar;201(3):637-648. doi: 10.1007/s00442-023-05344-7. Epub 2023 Mar 10. Oecologia. 2023. PMID: 36894790 Free PMC article.
-
Interspecies Scaling of Transgene Products for Viral Vector Gene Therapies: Method Assessment Using Data from Eleven Viral Vectors.AAPS J. 2023 Oct 27;25(6):101. doi: 10.1208/s12248-023-00867-6. AAPS J. 2023. PMID: 37891410
References
-
- Kleiber M. (1932) Hilgardia 6, 315-353.
-
- Schmidt-Nielsen K., (1984) Scaling: Why Is Animal Size so Important? (Cambridge Univ. Press, Cambridge, U.K.).
-
- Peters R. H., (1983) The Ecological Implications of Body Size (Cambridge Univ. Press, Cambridge, U.K.).
-
- Hemmingsen A. M. (1950) Rep. Stenographic Mem. Hosp. (Copenhagen) 4, 1-58.
-
- Niklas K. J., (1994) Plant Allometry: The Scaling of Form and Process (Univ. of Chicago Press, Chicago).
Publication types
MeSH terms
Grants and funding
LinkOut - more resources
Full Text Sources
Other Literature Sources
