

. 2002 Feb 19;99 Suppl 1(Suppl 1):2538-45.
doi: 10.1073/pnas.012582499.
Complexity and robustness
Affiliations
- PMID: 11875207
- PMCID: PMC128573
- DOI: 10.1073/pnas.012582499
Item in Clipboard
Complexity and robustness
Proc Natl Acad Sci U S A.
.
Abstract
Highly optimized tolerance (HOT) was recently introduced as a conceptual framework to study fundamental aspects of complexity. HOT is motivated primarily by systems from biology and engineering and emphasizes, (i) highly structured, nongeneric, self-dissimilar internal configurations, and (ii) robust yet fragile external behavior. HOT claims these are the most important features of complexity and not accidents of evolution or artifices of engineering design but are inevitably intertwined and mutually reinforcing. In the spirit of this collection, our paper contrasts HOT with alternative perspectives on complexity, drawing on real-world examples and also model systems, particularly those from self-organized criticality.
Figures
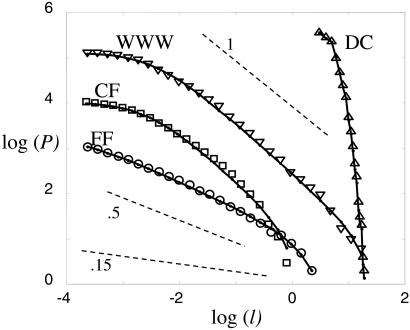
Log–log (base 10) comparison of DC, WWW, CF, and FF data (symbols) with PLR models (solid lines) (for β = 0, 0.9, 0.9, 1.85, or α = 1/β = ∞, 1.1,1.1, 0.054, respectively) and the SOC FF model (α = 0.15, dashed). Reference lines of α = 0.5, 1 (dashed) are included. The cumulative distributions of frequencies 𝒫(l ≥ li) vs. li describe the areas burned in the largest 4,284 fires from 1986 to 1995 on all of the U.S. Fish and Wildlife Service Lands (FF) (17), the >10,000 largest California brushfires from 1878 to 1999 (CF) (18), 130,000 web file transfers at Boston University during 1994 and 1995 (WWW) (19), and code words from DC. The size units [1,000 km2 (FF and CF), megabytes (WWW), and bytes (DC)] and the logarithmic decimation of the data are chosen for visualization.
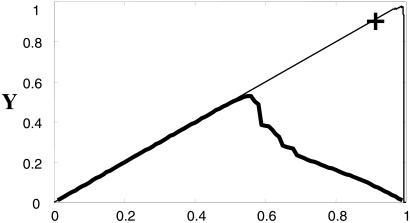
Yield vs. density curves for 64 × 64 random and HOT lattices. Here and in Fig. 3, we take P(i,j) = exp(−η(i + j)/N) with η = 24. The heavy solid line illustrates the percolation forest fire model, with maximum yield at ρc. The light solid line illustrates the results generated by the local incremental algorithm, where the maximum yield point corresponds to Fig. 3c. The + marks the result for grid design (Fig. 3d).
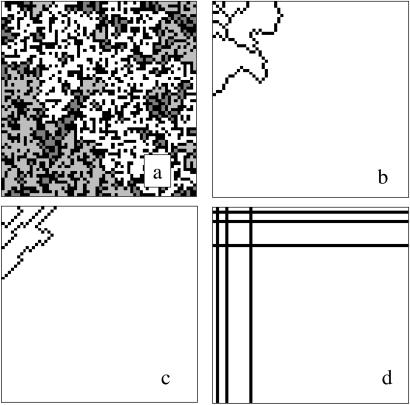
Sample lattices contrasting criticality and HOT: (a) The percolation forest fire model at ρc and HOT configurations obtained by (b) Darwinian evolution, (c) local incremental algorithm, and (d) grid design. Empty sites are black, and occupied clusters are grayscale (percolation) or white (HOT). Simulation parameters are as in Fig. 2.
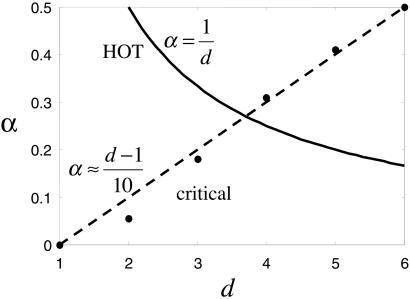
Exponent α versus dimension d for percolation and HOT. The results for percolation (dots) are taken from ref. , and the fit α ≈(d−1)/10 is approximate.
References
-
- Carlson J. M. & Doyle, J. (1999) Phys. Rev. E 60, 1412-1427. - PubMed
-
- Carlson J. M. & Doyle, J. (2000) Phys. Rev. Lett. 84, 2529-2532. - PubMed
-
- Doyle J. & Carlson, J. M. (2000) Phys. Rev. Lett. 84, 5656-5659. - PubMed
-
- Zhou T. & Carlson, J. M. (2000) Phys. Rev. E 62, 3197-3204. - PubMed
-
- Robert C., Carlson, J. M. & Doyle, J. (2001) Phys. Rev. E 63, 56122., 1–13. - PubMed
LinkOut - more resources
Full Text Sources
