

. 2002 Feb 19;99 Suppl 1(Suppl 1):2566-72.
doi: 10.1073/pnas.012582999.
Random graph models of social networks
Affiliations
- PMID: 11875211
- PMCID: PMC128577
- DOI: 10.1073/pnas.012582999
Item in Clipboard
Random graph models of social networks
Proc Natl Acad Sci U S A.
.
Abstract
We describe some new exactly solvable models of the structure of social networks, based on random graphs with arbitrary degree distributions. We give models both for simple unipartite networks, such as acquaintance networks, and bipartite networks, such as affiliation networks. We compare the predictions of our models to data for a number of real-world social networks and find that in some cases, the models are in remarkable agreement with the data, whereas in others the agreement is poorer, perhaps indicating the presence of additional social structure in the network that is not captured by the random graph.
Figures
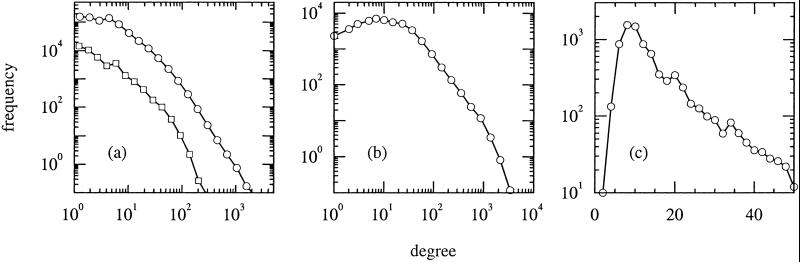
Degree distributions for three different types of networks: (a) scientific collaboration networks of biologists (circles) and physicists (squares); (b) a collaboration network of movie actors; (c) network of directors of Fortune 1000 companies. Note that c has a linear horizontal axis, while all other axes are logarithmic. Solid lines between points are merely a guide to the eye. a and b after Newman (14) and Amaral et al. (13), respectively. Data for c kindly provided by G. Davis.
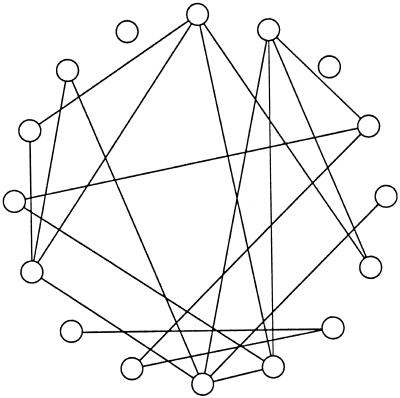
An example of a standard random graph of the type first discussed by Erdős and Rényi (23). In this case, the number of vertices N is 16 and the probability p of an edge is 1/7.
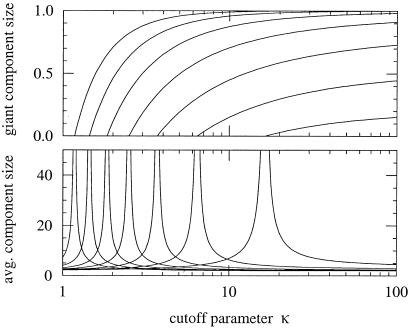
Size S of the giant component (Top) and average size 〈s〉 of clusters excluding the giant component (Bottom) for graphs with the degree distribution given in Eq. 9, as a function of the cutoff parameter κ. The curves are for, left to right, τ = 0.6–3.2 in steps of 0.4.
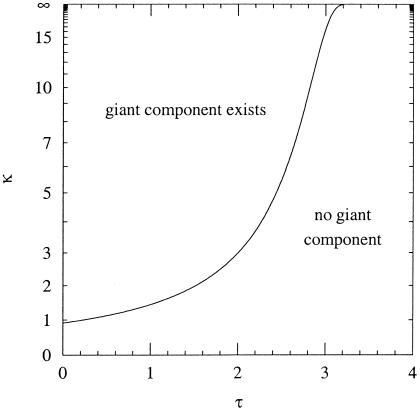
Phase diagram for networks with the skewed degree distribution defined in Eq. 9. The solid line marks the boundary between the region in which a giant component exists and the one in which it does not.
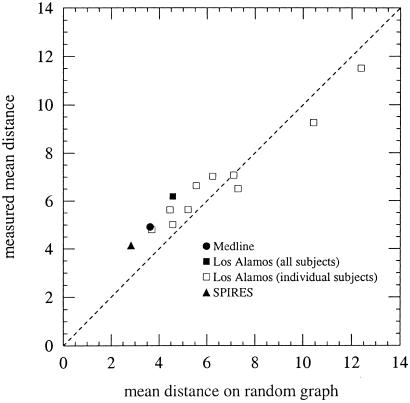
Mean distance between vertices in 13 scientific collaboration networks, from the theoretical prediction, Eq. 14, and from direct measurements. If theory and measurement agreed perfectly, all points would lie on the dotted line [after Newman (17)].
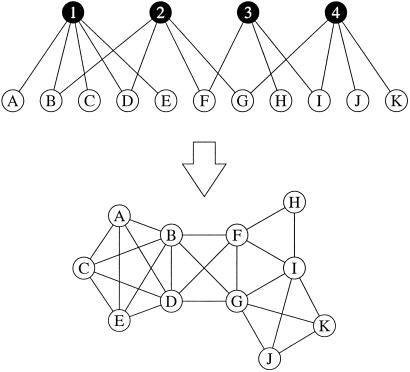
(Top) A bipartite network. One can imagine the vertices A to K as being, for example, company directors, and vertices 1 to 4 as being boards that they sit on, with lines joining each director to the appropriate boards. (Bottom) The unipartite projection of the same network, in which two directors are connected by an edge if they sit on a board together.
References
-
- Wasserman S. & Faust, K., (1994) Social Network Analysis (Cambridge Univ. Press, Cambridge, U.K.).
-
- Scott J., (2000) Social Network Analysis: A Handbook (Sage Publications, London).
-
- Strogatz S. H. (2001) Nature (London) 410, 268-276. - PubMed
-
- Albert, R. & Barabási, A.-L. (2001) Rev. Mod. Phys., in press.
-
- Albert R., Jeong, H. & Barabási, A.-L. (2000) Nature (London) 406, 378-382. - PubMed
Publication types
MeSH terms
LinkOut - more resources
Full Text Sources
Other Literature Sources
