. 2002 Mar 4;195(5):535-45.
doi: 10.1084/jem.20011751.

Essential immunoregulatory role for BCAP in B cell development and function

Affiliations

Essential immunoregulatory role for BCAP in B cell development and function

Tetsuo Yamazaki et al. J Exp Med. .

Abstract

BCAP was recently cloned as a binding molecule to phosphoinositide 3-kinase (PI3K). To investigate the role of BCAP, mutant mice deficient in BCAP were generated. While BCAP-deficient mice are viable, they have decreased numbers of mature B cells and B1 B cell deficiency. The mice produce lower titers of serum immunoglobulin (Ig)M and IgG3, and mount attenuated responses to T cell--independent type II antigen. Upon B cell receptor cross-linking, BCAP-deficient B cells exhibit reduced Ca(2+) mobilization and poor proliferative responses. These findings demonstrate that BCAP plays a pivotal immunoregulatory role in B cell development and humoral immune responses.


Figures

Figure 1.
Figure 1.
Generation of BCAP−/− mice. (A) Schematic representation of the strategy used to target the BCAP locus. Exons are presented as shaded boxes and numbered, where the exon containing the initiation methionine corresponds to exon 1. Exon 8 (E8) harboring three YxxM motifs was replaced with the neomycin selection cassette (neo). Neo and thymidine kinase (tk) are shown as open arrows that indicate the direction of transcription. A probe used for Southern blot analysis is also shown as a bar. EV; EcoRV. (B) Representative Southern blot analysis of genomic DNA of progeny mice. Tail DNA was digested with EcoRV and probed with the external probe shown in panel A. +/+, +/−, and −/− indicate wild-type, heterozygous, and homozygous mice, respectively. (C) Northern blot analysis of total RNA from the spleen. A blot was hybridized with either BCAP full-length cDNA or β-actin. (D) Western blot analysis of BCAP protein from splenocytes. Immunoprecipitates from lysates with antiserum to BCAP or anti-BLNK antibody were immunoblotted with the same antibodies.
Figure 1.
Figure 1.
Generation of BCAP−/− mice. (A) Schematic representation of the strategy used to target the BCAP locus. Exons are presented as shaded boxes and numbered, where the exon containing the initiation methionine corresponds to exon 1. Exon 8 (E8) harboring three YxxM motifs was replaced with the neomycin selection cassette (neo). Neo and thymidine kinase (tk) are shown as open arrows that indicate the direction of transcription. A probe used for Southern blot analysis is also shown as a bar. EV; EcoRV. (B) Representative Southern blot analysis of genomic DNA of progeny mice. Tail DNA was digested with EcoRV and probed with the external probe shown in panel A. +/+, +/−, and −/− indicate wild-type, heterozygous, and homozygous mice, respectively. (C) Northern blot analysis of total RNA from the spleen. A blot was hybridized with either BCAP full-length cDNA or β-actin. (D) Western blot analysis of BCAP protein from splenocytes. Immunoprecipitates from lysates with antiserum to BCAP or anti-BLNK antibody were immunoblotted with the same antibodies.
Figure 2.
Figure 2.
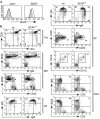
Flow cytometric analysis of lymphocyte populations in BCAP−/−mice. (A) Expression of BCAP in splenic B cells. Spleen cells stained for CD3 and B220 were analyzed by flow cytometric intracellular staining with an antiserum to BCAP plus goat anti–rabbit IgG-FITC (thick solid line, wild-type mice; shaded area, BCAP−/− mice). Data shown are representative of three independent experiments. (B) Single-cell suspensions from thymus (Thy), bone marrow (BM), lymph node (LN), spleen (SP), and peritoneal cavity (PerC), were stained with the indicated Abs and analyzed using a FACScan® (wt, wild-type mice). Numbers indicate the percentages of lymphoid cells in the quadrants or enclosed areas. IgM versus IgD and CD21 versus CD23 profiles are shown for B220+ cells, and CD11b versus CD16 profile for B220 cells. Data shown are representative of six independent experiments.
Figure 3.
Figure 3.
Serum immunoglobulin titers and the humoral responses in BCAP−/− mice. (A) The concentrations of serum Ig isotypes measured by ELISA. The values for each individual wild-type (•) and BCAP−/− (○) mouse tested are plotted. Bars indicate mean values. (B) Attenuated TI-II responses in BCAP−/− mice. Group of five wild-type (•) and BCAP−/− (○) mice were immunized with the TI-II antigen TNP-Ficoll. Mice were bled before (d 0) and 7 d (d 7) after immunization. TNP-specific immunoglobulins of the indicated isotypes were expressed in relative units compared with a standard titrated serum. Representative data of two independent experiments are shown. (C) Group of four wild-type (•) and BCAP−/− (○) mice were immunized with the TD antigen TNP-KLH. Mice were reimmunized with the same antigen at day 14, and were bled before (d 0) immunization and at day 14 (d 14) and 21 (d 21). Relative amounts of TNP-specific immunoglobulins were analyzed as described in B. Representative data of two independent experiments are shown.
Figure 4.
Figure 4.
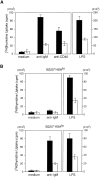
Impaired proliferative response of BCAP−/− splenic B cells. (A) Purified splenic B cells from wild-type and BCAP−/− mice were cultured with medium, F(ab′)2 goat anti-IgM Ab (15 μg/ml), rat anti-CD40 Ab (10 μg/ml), or LPS (10 μg/ml). The mean and standard deviations are plotted for wild-type (black bars) and BCAP−/− splenic B cells (white bars). Experiments were performed in triplicates. Data shown are representative of three independent experiments. (B) Splenic B cells from the indicated mice were sorted into B220+HSAhi (immature B) and B220+HSAlo (mature B) subsets, and experiments were performed in triplicates. Data shown are representative of three independent experiments.
Figure 5.
Figure 5.
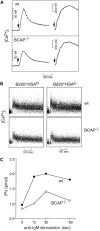
Defective Ca2+ mobilization in BCAP−/− splenic B cells. (A) Splenic B cells were loaded with Fura-2/AM. Cell were washed, stimulated with F(ab′)2 goat anti-IgM Ab (15 μg/ml), and then with ionomycin (1 μM). Fluorescence from the cell suspension was continuously monitored using a Hitachi F-2000 fluorescence spectrophotometer. In three other experiments, peak values of [Ca2+]i in BCAP−/− B cells were 55, 63, and 66% of those in wild-type B cells, respectively. Data shown are representative of four independent experiments. (B) Erythrocyte-depleted splenocytes were loaded with Indo-1AM. Fluorescence from each subpopulation was collected on a BD LSR. Ca2+ concentrations are represented as the ratio of bound to unbound Indo-1. Data shown are representative of three independent experiments. (C) Reduced IP3 generation in BCAP−/− splenic B cells. Splenic B cells were stimulated with F(ab′)2 goat anti-IgM Ab (15 μg/ml), and lyzed. IP3 generation from 107 cells at each time point was measured (•, wild-type; ○, BCAP−/−). In three other experiments, amounts of IP3 in BCAP−/− B cells (after 30 s of anti-IgM stimulation) were reduced by 20, 27, and 30%, respectively, compared with those in wild-type B cells. Data shown are representative of four independent experiments.
Figure 6.
Figure 6.
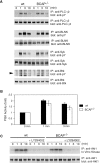
Tyrosine phosphorylation in BCAP−/− splenic B cells. (A) BCR-elicited tyrosine phosphorylation status of PLC-γ2, BLNK, Syk, and Btk. Splenic B cells (2 × 10⁷ cells for each time point) were stimulated with F(ab′)2 goat anti-IgM Ab (15 μg/ml), lyzed, and immunoprecipitated with the indicated antibodies. Immune complexes were resolved by SDS-PAGE and sequentially immunoblotted with anti-phosphotyrosine and the immunoprecipitating antibody. Data shown are representative of three independent experiments. (B) BCR-mediated PI3K activation. The results present the fold activation as a stimulation index between resting and activated cells. The mean and standard deviations of three independent experiments are plotted for wild-type (black bars) and BCAP−/− splenic B cells (white bars). (C) BCR-induced activation of Akt. Either with or without 15 min incubation with 10 μM LY294002, splenic B cells were stimulated with F(ab′)2 goat anti-IgM Ab (15 μg/ml), lyzed, and immunoprecipitated with anti-Akt 1 Ab. Half of Akt immunoprecipitates was assayed for in vitro kinase activity using H2B as a substrate. The reactions were separated by SDS-PAGE and autoradiogrammed (top panel). The protein levels of Akt were analyzed using the remaining half of Akt immunoprecipitates (bottom panel). Data shown are representative of three independent experiments.

Similar articles

Cited by

References

    1. Meffre, E., R. Casellas, and M.C. Nussenzweig. 2000. Antibody regulation of B cell development. Nat. Immunol. 1:379–385. - PubMed
    1. Hardy, R.R., and K. Hayakawa. 2001. B cell development pathways. Annu. Rev. Immunol. 19:595–621. - PubMed
    1. Benschop, R.J., and J.C. Cambier. 1999. B cell development: signal transduction by antigen receptors and their surrogates. Curr. Opin. Immunol. 11:143–151. - PubMed
    1. Rajewsky, K. 1996. Clonal selection and learning in the antibody system. Nature. 381:751–758. - PubMed
    1. Loder, F., B. Mutschler, R.J. Ray, C.J. Paige, P. Sideras, R. Torres, M.C. Lamers, and R. Carsetti. 1999. B cell development in the spleen takes place in discrete steps and is determined by the quality of B cell receptor-derived signals. J. Exp. Med. 190:75–89. - PMC - PubMed

Publication types