. 2002 Mar 4;195(5):625-36.
doi: 10.1084/jem.20011786.

Functionally distinct subsets of CD1d-restricted natural killer T cells revealed by CD1d tetramer staining

Affiliations

Functionally distinct subsets of CD1d-restricted natural killer T cells revealed by CD1d tetramer staining

Jenny E Gumperz et al. J Exp Med. .

Abstract

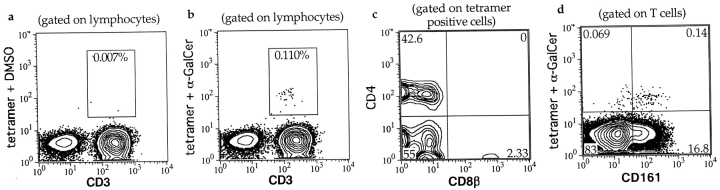
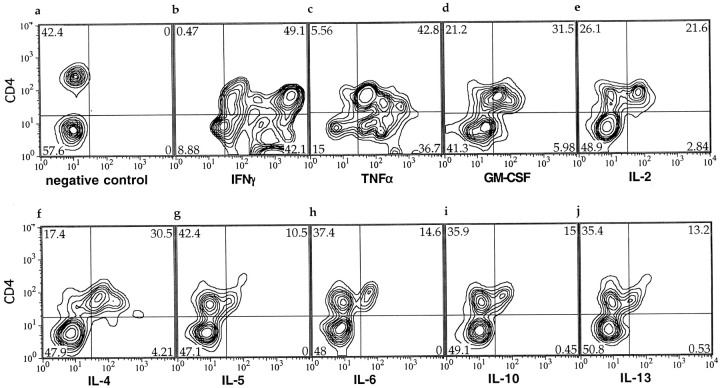
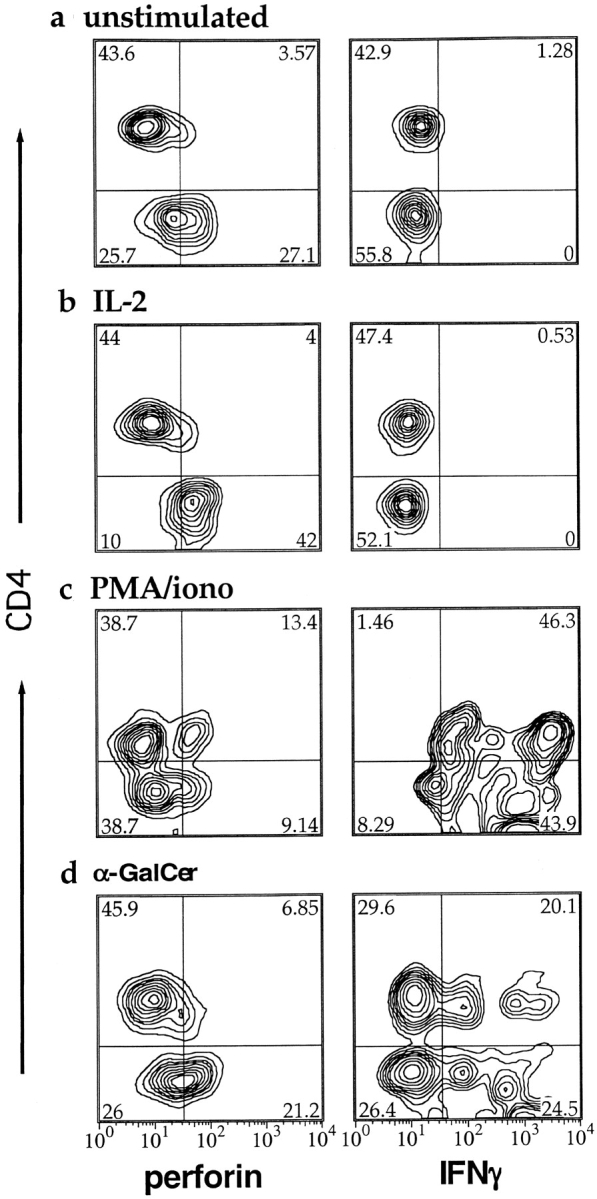
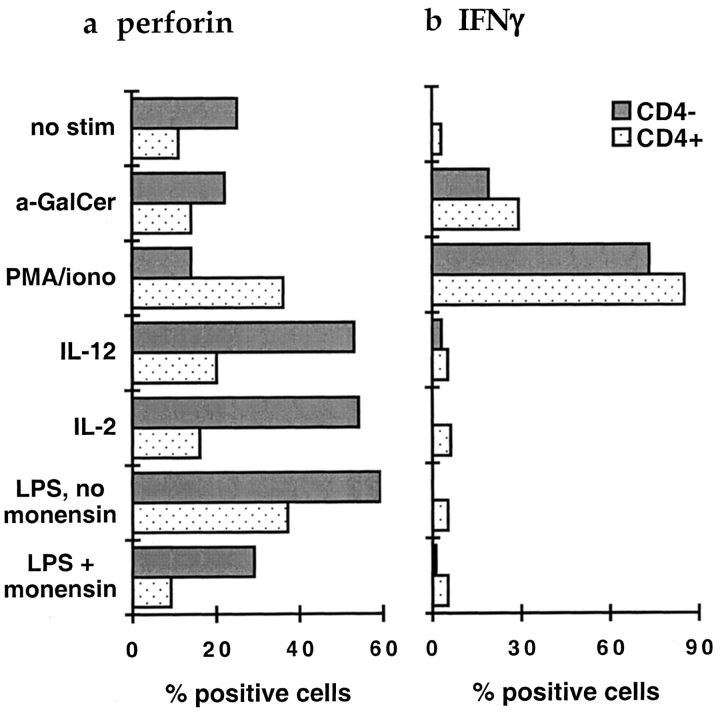
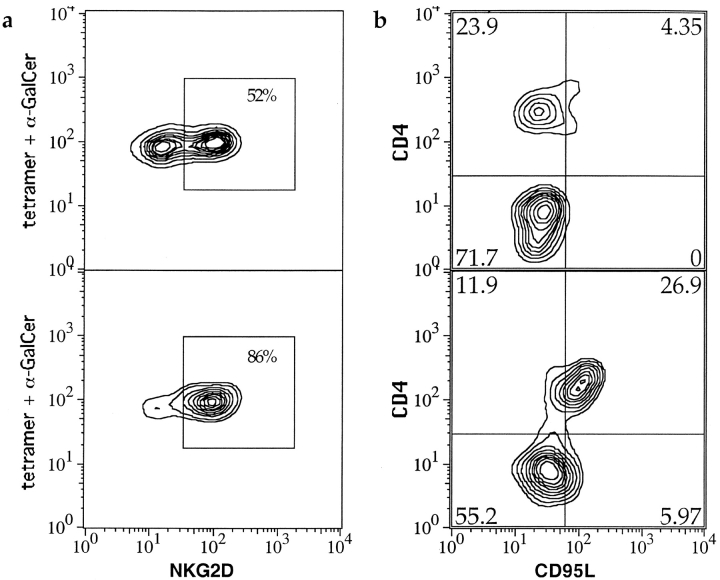
CD1d-restricted natural killer (NK)T cells are known to potently secrete T helper (Th)1 and Th2 cytokines and to mediate cytolysis, but it is unclear how these contrasting functional activities are regulated. Using lipid antigen-loaded CD1d tetramers, we have distinguished two subsets of CD1d-restricted T cells in fresh peripheral blood that differ in cytokine production and cytotoxic activation. One subset, which was CD4(-), selectively produced the Th1 cytokines interferon gamma and tumor necrosis factor alpha, and expressed NKG2d, a marker associated with cytolysis of microbially infected and neoplastic cells. This subset up-regulated perforin after exposure to interleukin (IL)-2 or IL-12. In contrast, CD4(+) CD1d-restricted NKT cells potently produced both Th1 and Th2 cytokines, up-regulated perforin in response to stimulation by phorbol myristate acetate and ionomycin but not IL-2 or IL-12, and could be induced to express CD95L. Further, for both CD1d-restricted NKT cell subsets, we found that antigenic stimulation induced cytokine production but not perforin expression, whereas exposure to inflammatory factors enhanced perforin expression but did not stimulate cytokine production. These results show that the various activities of CD1d-restricted T cells in tumor rejection, autoimmune disease, and microbial infections could result from activation of functionally distinct subsets, and that inflammatory and antigenic stimuli may influence different effector functions.


Figures

Figure 1.
Figure 1.
Flow cytometric staining of fresh human PBMCs using CD1d-Fc tetramers and antibodies against cell surface markers. a, b, and d are composite contour/dot plots, in which areas of infrequent events are shown as individual dots and higher density areas are shown as concentric probability contours with each successive layer depicting an increased frequency of events. a and b show lymphocytes from a PBMC sample that was stained with anti-CD3, and CD1d tetramers treated with DMSO or α-GalCer, respectively. c is a contour plot showing the CD4 and CD8β staining of α-GalCer–loaded tetramer positive lymphocytes. d shows the CD161 and α-GalCer–loaded CD1d tetramer staining of CD3+ lymphocytes. Numbers in boxed areas of a and b, and in the corners of c and d show the percentage of events contained within the boxes or quadrants, respectively.
Figure 2.
Figure 2.
Flow cytometric probability contour plots of CD1d tetramer positive lymphocytes stained for intracellular cytokines. The plots are gated on the α-GalCer–loaded CD1d tetramer positive lymphocytes within a PBMC sample, and show staining with anti-CD4 on the y-axes, and antibodies to the intracelluar cytokines shown (b-j), or a negative control (a), on the x-axes. Plots b-j show staining of a PBMC sample that was stimulated with PMA and ionomycin in the presence of monensin. The negative control antibody staining (a) was performed on an unstimulated PBMC sample from the same donor. Numbers in the corners indicate the percentage of the events contained within each quadrant.
Figure 3.
Figure 3.
Flow cytometric probability contour plots showing intracellular perforin and IFN-γ staining of CD1d tetramer positive lymphocytes after stimulation. The plots are gated on α-GalCer–loaded CD1d tetramer positive lymphocytes within a PBMC sample, after the following treatments: no stimulation (a); IL-2 stimulation (b); PMA/ionomycin stimulation (c); and α-GalCer stimulation (d). The left column shows perforin staining, and the right shows IFN-γ staining. The y-axes of all plots show CD4 staining on a four decade log scale. Numbers in the corners indicate the percentage of the events contained within each quadrant.
Figure 4.
Figure 4.
Mean percentages of CD1d tetramer positive cells staining positively for perforin and IFN-γ after stimulation. Plot a shows perforin staining, plot b shows IFN-γ staining, after stimulation as shown on the y-axis at the left. Gray bars show CD4 and stippled bars show CD4+ CD1d tetramer positive cells. Results are from six independent experiments on three healthy donors.
Figure 5.
Figure 5.
Flow cytometric probability contour plots showing NKG2d and CD95L staining of CD1d tetramer positive cells. The plots are gated on CD1d tetramer positive lymphocytes. a shows NKG2d staining of a sample before depletion of CD4+ cells (top panel), compared with NKG2d staining after depletion of CD4+ cells (bottom panel). b shows CD4 staining compared with intracellular staining for CD95L for an unstimulated sample (top panel), and a PMA and ionomycin stimulated sample (bottom panel).

References

    1. Porcelli, S.A., and R.L. Modlin. 1999. The CD1 system: antigen-presenting molecules for T cell recognition of lipids and glycolipids. Annu. Rev. Immunol. 17:297–329. - PubMed
    1. Bendelac, A., O. Lantz, M.E. Quimby, J.W. Yewdell, J.R. Bennink, and R.R. Brutkiewicz. 1995. CD1 recognition by mouse NK1+ T lymphocytes. Science. 268:863–865. - PubMed
    1. Exley, M., J. Garcia, S.P. Balk, and S. Porcelli. 1997. Requirements for CD1d recognition by human invariant Vα24+ CD4−CD8− T cells. J. Exp. Med. 186:109–120. - PMC - PubMed
    1. Chen, H., and W.E. Paul. 1997. Cultured NK1.1+ CD4+ T cells produce large amounts of IL-4 and IFN-γ upon activation by anti-CD3 or CD1. J. Immunol. 159:2240–2249. - PubMed
    1. Koseki, H., H. Asano, T. Inaba, N. Miyashita, K. Moriwaki, K.F. Lindahl, Y. Mizutani, K. Imai, and M. Taniguchi. 1991. Dominant expression of a distinctive V14+ T-cell antigen receptor α chain in mice. Proc. Natl. Acad. Sci. USA. 88:7518–7522. - PMC - PubMed

Publication types