. 2002 Mar 4;195(5):637-41.
doi: 10.1084/jem.20011908.

Distinct functional lineages of human V(alpha)24 natural killer T cells

Affiliations

Distinct functional lineages of human V(alpha)24 natural killer T cells

Peter T Lee et al. J Exp Med. .

Abstract

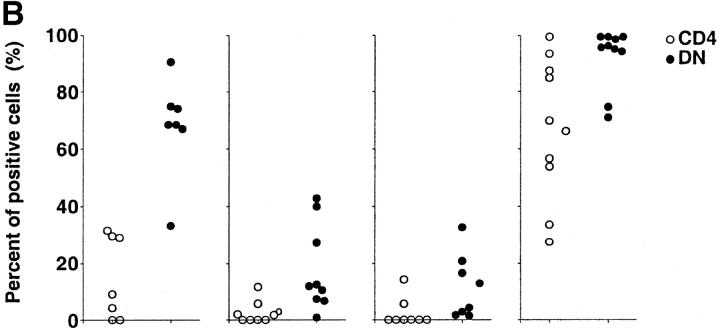
CD1d-restricted autoreactive natural killer (NK)T cells have been reported to regulate a range of disease conditions, including type I diabetes and immune rejection of cancer, through the secretion of either T helper (Th)2 or Th1 cytokines. However, mechanisms underlying Th2 versus Th1 cytokine secretion by these cells are not well understood. Since most healthy subjects express <1 NKT cell per 1,000 peripheral blood lymphocytes (PBLs), we devised a new method based on the combined used of T cell receptor (TCR)-specific reagents alpha-galactosylceramide (alphaGalCer) loaded CD1d-tetramers and anti-V(alpha)24 monoclonal antibody, to specifically identify and characterize these rare cells in fresh PBLs. We report here that CD4(+) and CD4(-)CD8(-) (double negative [DN]) NKT cell subsets represent functionally distinct lineages with marked differences in their profile of cytokine secretion and pattern of expression of chemokine receptors, integrins, and NK receptors. CD4(+) NKT cells were the exclusive producers of interleukin (IL)-4 and IL-13 upon primary stimulation, whereas DN NKT cells had a strict Th1 profile and prominently expressed several NK lineage receptors. These findings may explain how NKT cells could promote Th2 responses in some conditions and Th1 in others, and should be taken into consideration for intervention in relevant diseases.


Figures

Figure 1.
Figure 1.
Identification of human NKT cells. (A) NKT cells present among the PBL of 10 healthy adults were enumerated after double staining with CD1d-αGC tetramers followed by anti-Vα24. Each dot represents an individual sample. (B) PBL from individuals expressing high (top panels) or low (bottom panels) NKT cell numbers were stained with CD1d-αGC tetramers followed by anti-Vα24, -Vβ11, and CD4 mAb. Two-color combinations are displayed to illustrate correlations between different subsets. Right panels are gated on Vα24/CD1d-αGC double-positive cells.
Figure 1.
Figure 1.
Identification of human NKT cells. (A) NKT cells present among the PBL of 10 healthy adults were enumerated after double staining with CD1d-αGC tetramers followed by anti-Vα24. Each dot represents an individual sample. (B) PBL from individuals expressing high (top panels) or low (bottom panels) NKT cell numbers were stained with CD1d-αGC tetramers followed by anti-Vα24, -Vβ11, and CD4 mAb. Two-color combinations are displayed to illustrate correlations between different subsets. Right panels are gated on Vα24/CD1d-αGC double-positive cells.
Figure 2.
Figure 2.
Different cytokine and cytokine receptor profiles of CD4 and DN NKT cells. Fresh PBLs were rested or stimulated with PMA/ionomycin for 12 h before staining with CD1d-αGalCer tetramers followed by permeabilization and staining with mAbs to Vα24, CD4, and cytokines or cytokine receptors. (A) FACS® dot plots from a representative individual are shown, after gating on CD1d-αGalCer/Vα24 double-positive cells. Numbers in the quadrants indicate percentages of cells within the CD4 or DN subsets (top and bottom quadrants, respectively). (B) Summary of cytokine expression from 10 individual subjects. White circles represent the CD4 subset while black circles represent the DN subset. Significant differences (Student's paired t test) were found for IL-4 (P < 0.01) and IL-13 (P < 0.01). Staining of CD25 (IL-2Rα) was performed without membrane permeabilization.
Figure 2.
Figure 2.
Different cytokine and cytokine receptor profiles of CD4 and DN NKT cells. Fresh PBLs were rested or stimulated with PMA/ionomycin for 12 h before staining with CD1d-αGalCer tetramers followed by permeabilization and staining with mAbs to Vα24, CD4, and cytokines or cytokine receptors. (A) FACS® dot plots from a representative individual are shown, after gating on CD1d-αGalCer/Vα24 double-positive cells. Numbers in the quadrants indicate percentages of cells within the CD4 or DN subsets (top and bottom quadrants, respectively). (B) Summary of cytokine expression from 10 individual subjects. White circles represent the CD4 subset while black circles represent the DN subset. Significant differences (Student's paired t test) were found for IL-4 (P < 0.01) and IL-13 (P < 0.01). Staining of CD25 (IL-2Rα) was performed without membrane permeabilization.
Figure 3.
Figure 3.
Different chemokine receptor and integrin pattern of CD4 and DN NKT subsets. The CD1d-αGalCer/Vα24 double-positive PBLs were gated for analysis of CD4 and chemokine receptors or CD49a. (A) FACS® dot plots of a representative PBL sample. Numbers in the quadrants indicate percentages of cells within the CD4 or DN subsets (top and bottom quadrants, respectively). (B) Summary of chemokine receptor and CD49a expression from 10 individual subjects. White circles represent the CD4 subset, while black circles represent the DN subset. Significant differences (Student's paired t test) were found for CCR5 (P < 0.05), CCR6 (P < 0.01), CXCR6 (P < 0.05), and CD49a (P < 0.05).
Figure 3.
Figure 3.
Different chemokine receptor and integrin pattern of CD4 and DN NKT subsets. The CD1d-αGalCer/Vα24 double-positive PBLs were gated for analysis of CD4 and chemokine receptors or CD49a. (A) FACS® dot plots of a representative PBL sample. Numbers in the quadrants indicate percentages of cells within the CD4 or DN subsets (top and bottom quadrants, respectively). (B) Summary of chemokine receptor and CD49a expression from 10 individual subjects. White circles represent the CD4 subset, while black circles represent the DN subset. Significant differences (Student's paired t test) were found for CCR5 (P < 0.05), CCR6 (P < 0.01), CXCR6 (P < 0.05), and CD49a (P < 0.05).
Figure 4.
Figure 4.
Different patterns of NK receptor expression by CD4 and DN NKT cells. The CD1d-αGalCer/Vα24 double-positive PBLs were gated for analysis of CD4 and 2B4, CD94, NKG2A, or CD161. (A) FACS® dot plots of a representative PBL sample. Numbers in the quadrants indicate percentages of cells within the CD4 or DN subsets (top and bottom quadrants, respectively). (B) Summary of NK receptor expression from 10 individual subjects. White circles represent the CD4 subset, while black circles represent the DN subset. Significant differences (Student's paired t test) were found for 2B4 (P < 0.001), CD94 (P < 0.05), NKG2A (P < 0.05), and CD161 (P < 0.01).
Figure 4.
Figure 4.
Different patterns of NK receptor expression by CD4 and DN NKT cells. The CD1d-αGalCer/Vα24 double-positive PBLs were gated for analysis of CD4 and 2B4, CD94, NKG2A, or CD161. (A) FACS® dot plots of a representative PBL sample. Numbers in the quadrants indicate percentages of cells within the CD4 or DN subsets (top and bottom quadrants, respectively). (B) Summary of NK receptor expression from 10 individual subjects. White circles represent the CD4 subset, while black circles represent the DN subset. Significant differences (Student's paired t test) were found for 2B4 (P < 0.001), CD94 (P < 0.05), NKG2A (P < 0.05), and CD161 (P < 0.01).

References

    1. Park, S.H., and A. Bendelac. 2000. CD1-restricted T-cell responses and microbial infection. Nature. 406:788–792. - PubMed
    1. Godfrey, D.I., K.J.L. Hammond, L.D. Poulton, and A.G. Baxter. 2000. NKT cell facts, functions and fallacies. Immunol. Today. 21:573–583. - PubMed
    1. Janeway, C.A., Jr. 1990. γδ T cells: research on the frontlines of defence. Res. Immunol. 141:688–695. - PubMed
    1. Benlagha, K., and A. Bendelac. 2000. CD1d-restricted mouse Vα14 and human Vα24 T cells: lymphocytes of innate immunity. Semin. Immunol. 12:537–542. - PubMed
    1. Hammond, K.J.L., L.D. Poulton, L.J. Palmisano, P.A. Silveira, D.I. Godfrey, and A.G. Baxter. 1998. α/β-T cell receptor (TCR)+CD4−CD8− (NKT) thymocytes prevent insulin-dependent diabetes mellitus in nonobese diabetic (NOD)/Lt mice by the influence of interleukin (IL)-4 and/or IL-10. J. Exp. Med. 187:1047–1056. - PMC - PubMed

Publication types