. 2002 Mar;40(3):826-36.
doi: 10.1128/JCM.40.3.826-836.2002.

Ca3 fingerprinting of Candida albicans isolates from human immunodeficiency virus-positive and healthy individuals reveals a new clade in South Africa

Affiliations

Ca3 fingerprinting of Candida albicans isolates from human immunodeficiency virus-positive and healthy individuals reveals a new clade in South Africa

Elaine Blignaut et al. J Clin Microbiol. 2002 Mar.

Abstract

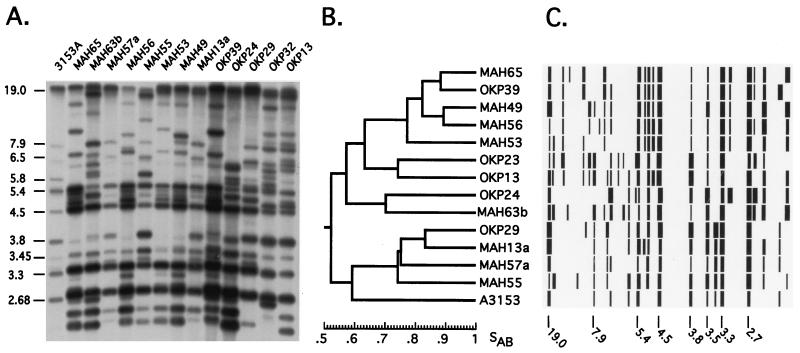
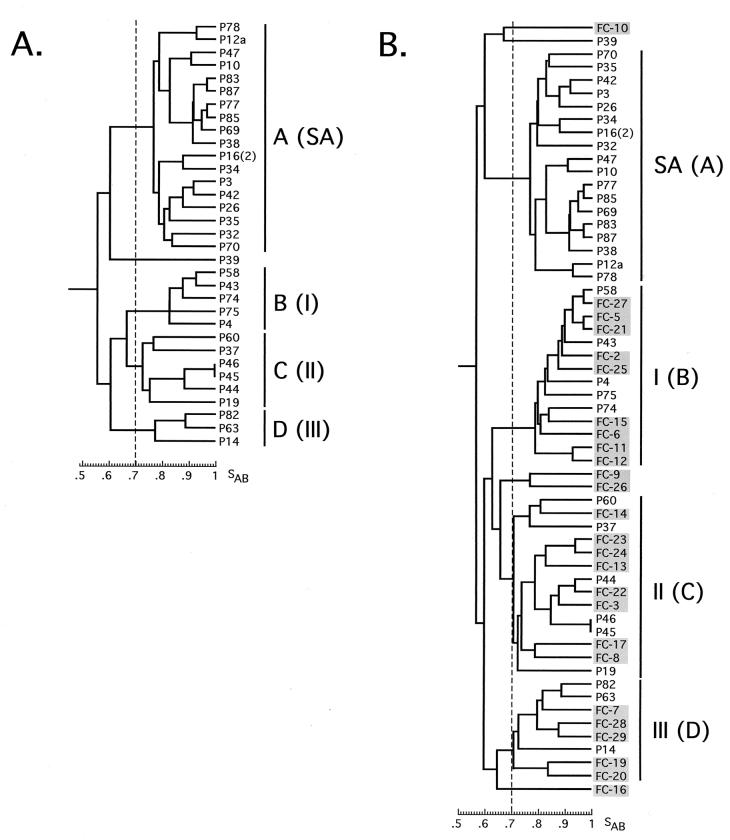
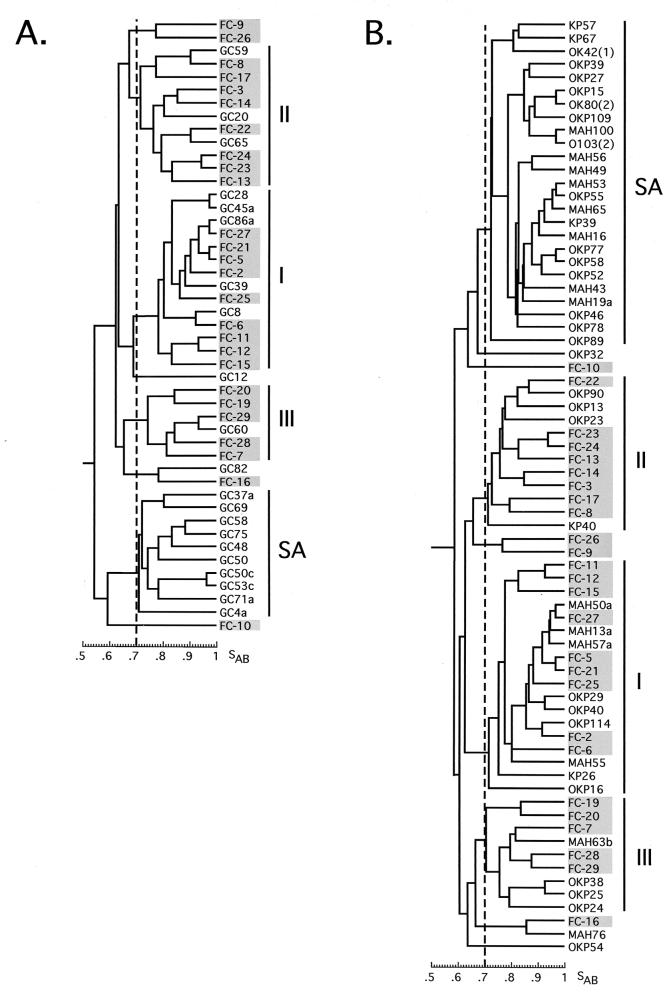
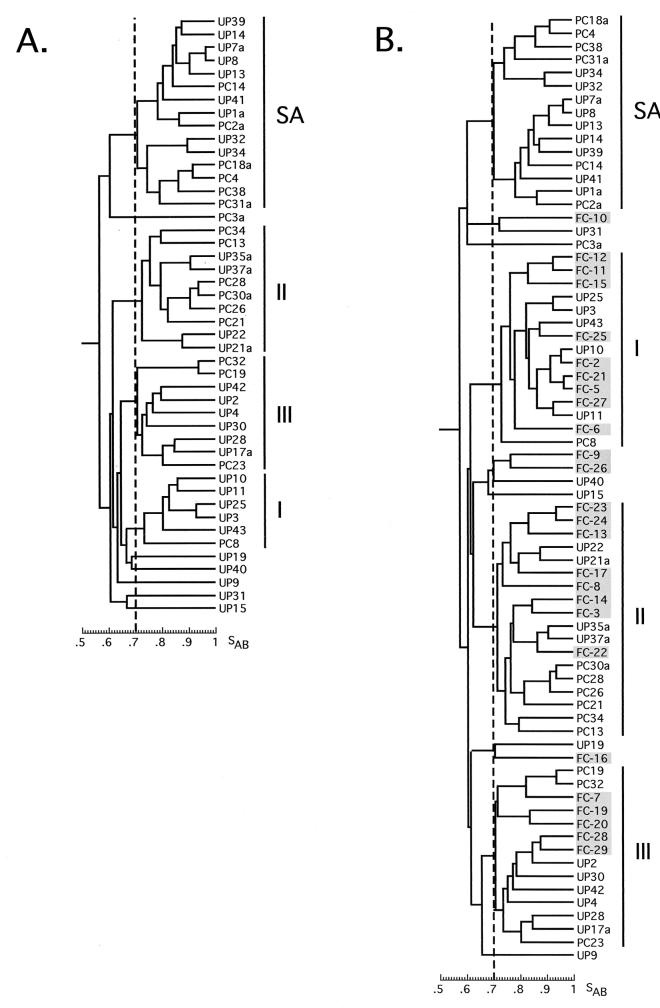
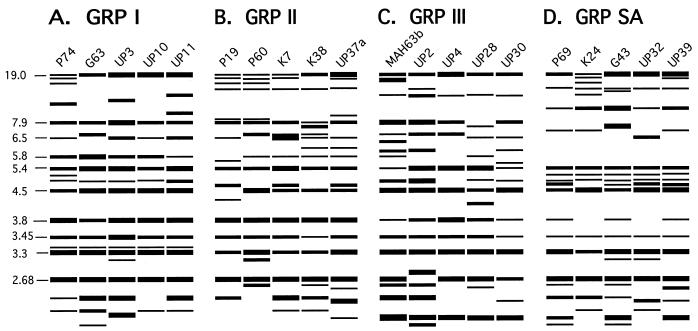
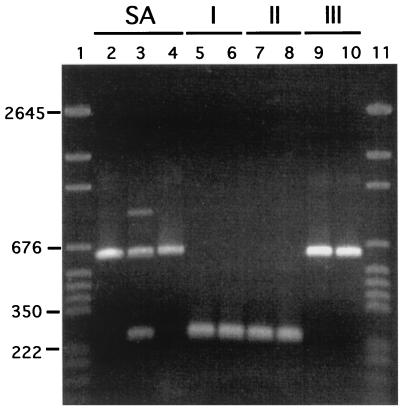
To examine the question of strain specificity in oropharyngeal candidiasis associated with human immunodeficiency virus (HIV) infection, oral samples were collected from 1,196 HIV-positive black South Africans visiting three clinics and 249 Candida albicans isolates were selected for DNA fingerprinting with the complex DNA fingerprinting probe Ca3. A total of 66 C. albicans isolates from healthy black South Africans and 46 from healthy white South Africans were also DNA fingerprinted as controls. Using DENDRON software, a cluster analysis was performed and the identified groups were compared to a test set of isolates from the United States in which three genetic groups (I, II, and III) were previously identified by a variety of genetic fingerprinting methods. All of the characterized South African collections (three from HIV-positive black persons, two from healthy black persons, and one from healthy white persons) included group I, II, and III isolates. In addition, all South African collections included a fourth group (group SA) completely absent in the U.S. collection. The proportion of group SA isolates in HIV-positive and healthy black South Africans was 53% in both cases. The proportion in healthy white South Africans was 33%. In a comparison of HIV-positive patients with and without oropharyngeal symptoms of infection, the same proportions of group I, II, III, and SA isolates were obtained, indicating no shift to a particular group on infection. However, by virtue of its predominance as a commensal and in infections, group SA must be considered the most successful in South Africa. Why group SA isolates represent 53 and 33% of colonizing strains in black and white South Africans and are absent in the U.S. collection represents an interesting epidemiological question.


Figures

FIG. 1.
FIG. 1.
Example of Ca3 fingerprint analysis of C. albicans isolates from South African collections. (A) EcoRI-digested DNA of each strain was separated by agarose gel electrophoresis, blotted, and hybridized with the complex C. albicans-specific DNA probe Ca3. Control strain 3153A was run in the first lane to assist in computer-assisted normalization (28). (B) Hybridization patterns were automatically normalized to the internal 3153A control pattern, and the global Ca3 reference pattern in the database, and lanes and bands were automatically identified, generating a matrix of band positions and intensities for all analyzed isolates. The similarity coefficient (SAB) between the patterns of every pair of isolates in a collection was computed, and a dendrogram based on the SAB values was generated. In this case, a dendrogram was generated for the isolates in panel A. (C) Each pattern was then converted into a model of band position and intensity and placed according to its position in the dendrogram. The molecular sizes in kilobases are noted to the left of the hybridization patterns in panel A and under the patterns in panel C.
FIG. 2.
FIG. 2.
(A) A cluster analysis of the Pretoria Academic Hospital isolates from HIV+ black individuals (P) reveals four groups, labeled A, B, C, and D. (B) P isolates plus U.S. isolates from the Pujol et al. (20) collection (FC) reveal four groups, with three (B, C, and D) equivalent to groups I, II, and III of the U.S. collection and the fourth (group A) representing a new South African-specific group (SA). An arbitrary threshold was set at SAB = 0.70.
FIG. 3.
FIG. 3.
(A) Cluster analysis of the Medunsa isolates from healthy black semiurban individuals (GC) plus U.S. isolates (FC). (B) Cluster analysis of Kruger Park (OKP and KP) and Mahonisi (MAH) isolates from healthy black rural individuals plus U.S. isolates (FC).
FIG. 4.
FIG. 4.
(A) Cluster analysis of Pretoria isolates from healthy white urban individuals (UP and PC). (B) Cluster analysis of UP and PC isolates plus U.S. isolates (FC).
FIG. 5.
FIG. 5.
DENDRON-generated models of Ca3 fingerprinting patterns of randomly selected isolates from group I (A), group II (B), group III (C), and group SA (D). Molecular sizes in kilobases are presented to the left of the models. Model band widths reflect band intensities.
FIG. 6.
FIG. 6.
IS1 is present in group III (lanes 9, 10) and group SA (lanes 2, 3, and 4) isolates but not in group I (lanes 5 and 6) and group II (lanes 7 and 8) isolates. IS1 was amplified with IS1-specific primers (14). The IS1-containing amplification product was 626 bp, and the amplification product lacking IS1 was 247 bp. Standards were run in lanes 1 and 11 (pGEM DNA markers from Promega, Madison, Wis.), and select standard sizes are noted to the left of the gel in kilobases.
FIG. 7.
FIG. 7.
(A) Model of node hierarchy observed in the dendrograms generated for all of the South African collections. (B) Tree representing the evolution of the four groups of C. albicans, based on node hierarchy in the dendrograms (panel A) and the presence of IS1. This tree is based on the one developed by Lott et al. (14) for the relationship of groups I, II, and III. The thinner branches reflect complete loss of IS1 from a group.

References

    1. Anderson, J., T. Srikantha, B. Morrow, S. H. Miyasaki, T. C. White, N. Agabian, J. Schmid, and D. R. Soll. 1993. Characterization and partial nucleotide sequence of the DNA fingerprinting probe Ca3 of Candida albicans. J. Clin. Microbiol. 31:1472-1480. - PMC - PubMed
    1. Arendorf, T. M., and D. M. Walker. 1980. The prevalence and intra-oral distribution of Candida albicans in man. Arch. Oral Biol. 25:1-10. - PubMed
    1. Brawner, D. L., and A. J. Hovan. 1995. Oral candidiasis in HIV-infected patients. Curr. Top. Med. Mycol. 6:113-125. - PubMed
    1. Coleman, D., D. Sullivan, B. Harrington, K. Haynes, M. Henman, D. Shanley, D. Bennett, G. Moran, C. McCreary, and L. O'Neill. 1997. Molecular and phenotypic analysis of Candida dubliniensis: a recently identified species linked with oral candidosis in HIV-infected and AIDS patients. Oral Dis. 3:S96-S101. - PubMed
    1. Coleman, D. C., D. E. Bennett, D. J. Sullivan, P. J. Gallagher, M. C. Henman, D. B. Shanley, and R. J. Russell. 1993. Oral Candida in HIV infection and AIDS: new perspectives/new approaches. Crit. Rev. Microbiol. 19:61-82. - PubMed

Publication types

LinkOut - more resources