. 2002 Mar 1;22(5):1883-94.
doi: 10.1523/JNEUROSCI.22-05-01883.2002.

Neuronal activity in substantia nigra pars reticulata during target selection

Affiliations

Neuronal activity in substantia nigra pars reticulata during target selection

Michele A Basso et al. J Neurosci. .

Abstract

Complex visual scenes require that a target for an impending saccadic eye movement be selected from a number of possible targets. We investigated whether changing the number of stimuli from which a target would be identified altered the activity of substantia nigra pars reticulata (SNr) neurons of the basal ganglia (BG) and how such changes might contribute to changes we observed previously in the superior colliculus (SC). One, two, four, or eight visual stimuli appeared on random trials while monkeys fixated a centrally located spot. After a delay, one of the stimuli in the array changed luminance, indicating that it was the saccade target. We found that SNr neurons that had a pause in tonic activity after target onset and when the saccade was made to the target showed a modulation of activity during the multitarget task. Because the number of stimuli in the array increased from one to eight, the initial pause after the onset of the visual stimulus decreased. Activity during the preselection delay was reduced but was independent of the number of possible targets present. When one of the stimuli was identified as the saccade target, but before the saccade was made, we found a sharp decline in activity. This decline was related to the monkey's selecting the target rather than the luminance change identifying the target, because on error trials, when the luminance changed but a saccade was not made to the target, the activity did not decline. The decline for the preferred target location was also accompanied by a lesser decline for adjacent locations. Our findings indicate that SNr activity changes with target selection as it does with saccade initiation and that the SNr could make substantial, direct contributions to the SC at both times. The pause in SNr activity with target selection is consistent with the hypothesis that BG provide a disinhibition for the selection of desired movements.


Figures
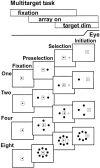
Fig. 1.
Fig. 1.
Multitarget task. Along the top, the bars labeled fixation, array on, andtarget dim depict the temporal sequence of the behavioral task used in this experiment. The line below, labeledEye, is a schematic of eye position. The bottom portion of the figure depicts the spatial arrangement of the task and the different trial types. The large boxes are the screen on which visual stimuli were displayed. Thecross represents the fixation point, and thesmall box indicates the eye position criterion window for correct performance of the task. Each of these trial types was randomly interleaved. As the number of possible target increased, the probability that any one would be identified for a saccade was decreased. The fixation period began with the onset of a fixation point located centrally on the screen. This was followed by a preselection period when the array of possible targets appeared. The selection period is indicated by the time in which the saccade target was identified by a reduction in luminance. The initiation period commenced when the cue to make a saccade, the removal of the fixation point, occurred. Each period of the task was separated by a random interval.
Fig. 2.
Fig. 2.
The SNr and SNc of a rhesus monkey. Two adjacent (50 μm) coronal sections are presented. In A, the section was stained with cresyl violet and the electrode path is evident (arrow). In B, the adjacent section was stained immunohistochemically for tyrosine hydroxylase (TH), the rate-limiting enzyme in the synthesis of the neurotransmitter dopamine (Cooper et al., 1986). Thebrown reaction product indicates the presence of TH. These sections demonstrate that the electrode penetrations made in these experiments passed through the SNc and into the SNr.CP, Cerebral peduncle; LGN, lateral geniculate nucleus.
Fig. 3.
Fig. 3.
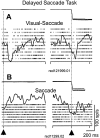
Examples of neuronal activity profiles in the SNr. The left column is aligned on the onset of the visual target (vertical dashed line and arrow), and theright column is aligned on the saccade (vertical dashed line and arrow). Eye position traces are plotted, superimposed as a function of time. Individualticks are action potentials, and each rowof ticks is a trial. Spike density functions are superimposed on the raster diagram. The spike density functions were calculated with a Gaussian of 12 msec. A, SNr visual-saccade neurons have a pause for the onset of the visual stimulus as well as before the saccade. B, SNr saccade neurons show a decline in activity at the time of the saccade.
Fig. 4.
Fig. 4.
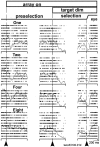
Effect of changes in target probability on an SNr visual-saccade neuron. The events of the task are indicated as the labeled periods across the top. The eye position trace is a schematic. The first row of rastersis for correct responses in the single possible target condition (One), the second is when two possible targets appeared (Two), and the third is when four possible targets appeared (Four). The last row is when eight possible targets appeared (Eight). Thecolumns of rasters are aligned on the events of the task: the first is aligned on when the stimuli appear, the second is aligned on target identification, by dimming, and the last is aligned on saccade initiation. Each tick in theraster is a single action potential, and eachrow of ticks is an individual trial. Thelines superimposed are spike density functions (ς = 12 msec). All data are taken from correct trials when the target was identified in the preferred field of the recorded neuron. Thearrowheads and the vertical dashed linesindicate the trace alignment. The initial pause decreased with increasing numbers of possible targets, and at the time the target was identified (middle column, vertical dashed line), the activity dropped precipitously. Vertical calibration bar: 100 spikes/sec.
Fig. 5.
Fig. 5.
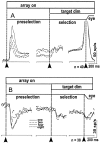
The activity across the sample of visual-saccade SNr neurons was modulated with changes in target probability. Thetraces show the mean spike density function of 38 SNr neurons in each target probability condition. For these traces, the target was always located in the center of the response field, and the trials were performed correctly. The black bars indicate a statistically significant difference between the four conditions during the measurement intervals. The gray bars indicate a lack of statistical significance. The initial preselection measurement interval was from 100 to 400 msec after the stimuli appeared. The second preselection interval was 400 msec before the target was identified. Because there was a minimum of 800 msec between task events, there is no overlap in the trace or the measurement intervals. The selection interval was 100–500 msec after the target dimmed.
Fig. 6.
Fig. 6.
The activity across the sample of saccade-related SNr neurons was not modulated with changes in target probability. Thetraces show the mean spike density function of 20 SNr neurons in each target probability condition. The arrangement of this figure is identical to that in Figure 5. For these traces, the target was always located in the center of the response field, and the trials were performed correctly. The gray bars indicate a lack of statistical significance. The initial preselection measurement interval was from 100 to 400 msec after the stimuli appeared. The second preselection interval was 400 msec before the target was identified. Because there was a minimum of 800 msec between task events, there is no overlap in the trace or the measurement intervals. The selection interval was 100–500 msec after the target dimmed. Note that these neurons showed a clear decline in activity before the saccade was initiated. Vertical calibration: 20 spikes/sec.
Fig. 7.
Fig. 7.
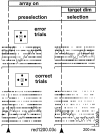
The activity decline of visual-saccade SNr neurons associated with target identification predicts the impending saccade. The temporal arrangement is shown on the top by thelabeled bars. The vertical dashed linesindicate the alignment of the traces. The top raster andspike density functions are taken from trials in which four possible targets were presented and the monkey made an erroneous saccade to one of the other stimuli. The bottoms rastersand spike densities are taken from correct trials in the same four possible target conditions. Note that the time of saccade initiation is not indicated for clarity. The decline in SNr neurons associated with the dimming of one stimulus to indicate it as the target for a saccade does not occur if the monkey does not select the target as a goal for a saccade.
Fig. 8.
Fig. 8.
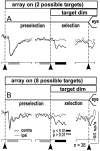
Comparison of neuronal activity related to identification of a target in and out of the preferred field of visual-saccade SNr neurons. The plot shows the mean activity of 38 SNr neurons. The arrangement of this plot is the same as in Figures 5 and 6. A shows the two possible targets condition when the target was identified in the preferred field (contra, thick line) and when the target was identified in the opposite hemifield (ipsi,thin line). The black bars indicate that there was a statistically significant difference in the neuronal activity in the two conditions during the selection interval (100–500 msec after the target dimmed). B shows the same traces for the eight possible targets condition. The data are taken from trials in which the monkeys performed the task correctly. These neurons show a clear decline in activity associated with the identification of the target and the initiation of the saccade when they are in the preferred field and not when in the opposite hemifield. Horizontal calibration: 200 msec.
Fig. 9.
Fig. 9.
Selectivity indices for SNr visual-saccade neurons and SNr saccade neurons. Neuronal activity is plotted as a function of target direction. The activity is normalized to the 0° location as the best response of the neurons in the eight possible targets condition. A, B, The visual index shows the activity of the neurons during the presentation of the visual stimulus 100–300 msec after onset of the array minus the 200 msec of baseline activity (during fixation but before the array appeared) divided by the sum of the same two activities. C,D, The selection index was defined as the activity 400 msec after the target dimmed (beginning at 100 msec after the dim) minus the 400 msec period before the target dimmed divided by the sum of these two activities. E, F, The initiation index was defined as the 150 msec around the saccade onset (before and after) minus the 200 msec baseline activity divided by the sum of the same two activities. In each plot, the results for two example neurons are shown (▴, ▪) as well as the mean of all neurons (●). Error bars indicate 1 SEM. Theasterisk indicates that the increase was significantly greater than baseline (Mann–Whitney U;p < 0.014).
Fig. 10.
Fig. 10.
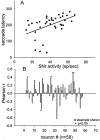
Correlation of saccade latency with SNr neuronal activity. A, Saccade latency as a function of neuronal activity averaged over 300 msec before the cue to move in a single SNr neuron is plotted. The line is the regression through the data points. For this neuron, the Pearson r value was 0.36, which was statistically significant (p < 0.05). B, The distribution of r values calculated for the 58 neurons. Three other SNr neurons had significant correlations with saccade latency (∗), and the example in A is indicated (∗∗). Note that the data are taken from all four possible target conditions, and there are not four “clumps” of data points indicating that there were no differences in latency between the different target conditions.
Fig. 11.
Fig. 11.
Comparison of SC and SNr neuronal activity in the multitarget task. A, The activity profiles of 40 SC neurons recorded in the multitarget task. The spike density functions were averaged for each neuron and superimposed for the four stimulus conditions. Each plot is aligned as in the other figures. The left plot is aligned on the array onset, the middle plot is aligned on the target dim, and the right plot is aligned on saccade initiation. This figure was taken from Basso and Wurtz (1998). B, The arrangement of this plot is identical to the plot inA except the data come from SNr recordings (see also Fig. 5). Note that the data from the SC and the SNr were recorded at different times and from different monkeys.

References

    1. Anderson ME, Yoshida M. Electrophysiological evidence for branching nigral projections to the thalamus and the superior colliculus. Brain Res. 1977;137:361–375. - PubMed
    1. Anderson ME, Yoshida M. Axonal branching patterns and location of nigrothalamic and nigrocollicular neurons in the cat. J Neurophysiol. 1980;43:883–895. - PubMed
    1. Basso MA, Evinger C. An explanation for reflex blink hyperexcitability in Parkinson's disease. II. Nucleus raphe magnus. J Neurosci. 1996;16:7318–7330. - PMC - PubMed
    1. Basso MA, Wurtz RH. Modulation of neuronal activity by target uncertainty. Nature. 1997;389:66–69. - PubMed
    1. Basso MA, Wurtz RH. Modulation of neuronal activity in superior colliculus by changes in target probability. J Neurosci. 1998;18:7519–7534. - PMC - PubMed

LinkOut - more resources