. 2002 Mar 1;22(5):1942-55.
doi: 10.1523/JNEUROSCI.22-05-01942.2002.

Persistent, exocytosis-independent silencing of release sites underlies homosynaptic depression at sensory synapses in Aplysia

Affiliations

Persistent, exocytosis-independent silencing of release sites underlies homosynaptic depression at sensory synapses in Aplysia

Tony D Gover et al. J Neurosci. .

Erratum in

  • J Neurosci 2002 Apr 15;22(8):3302

Abstract

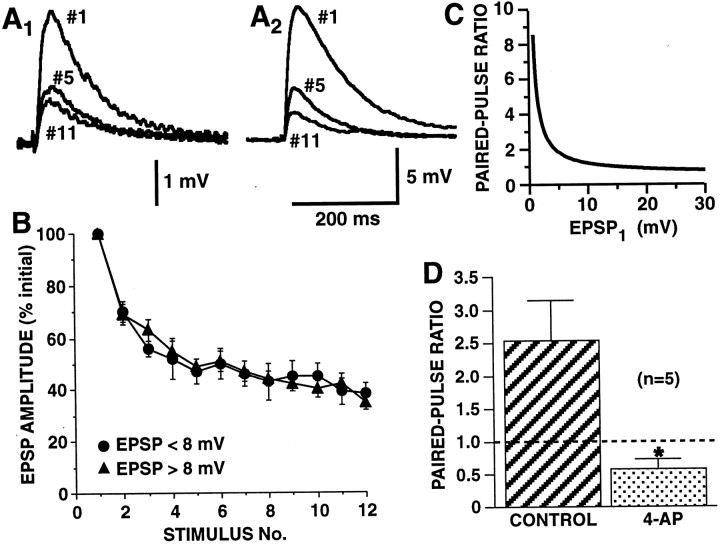
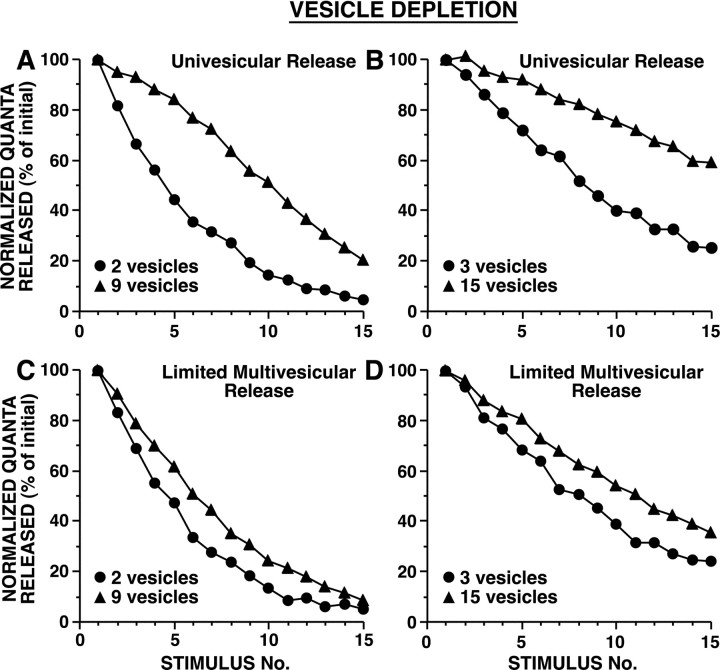
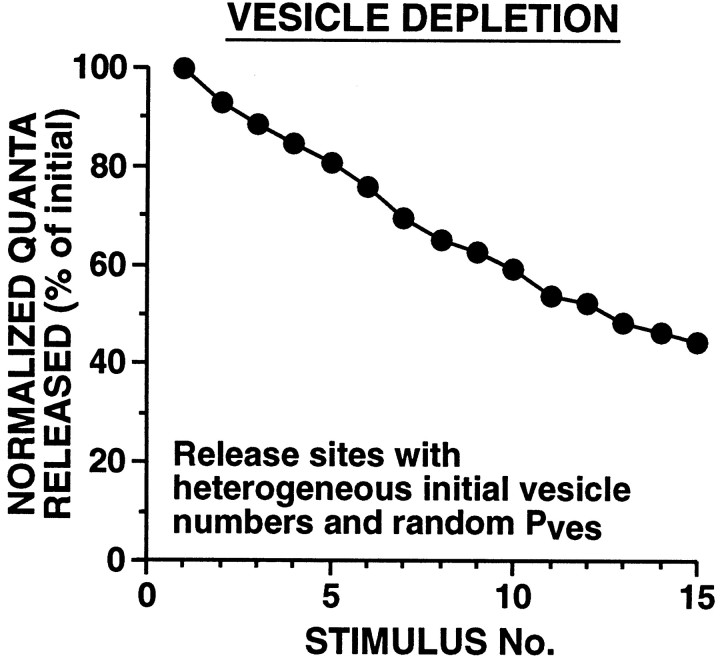
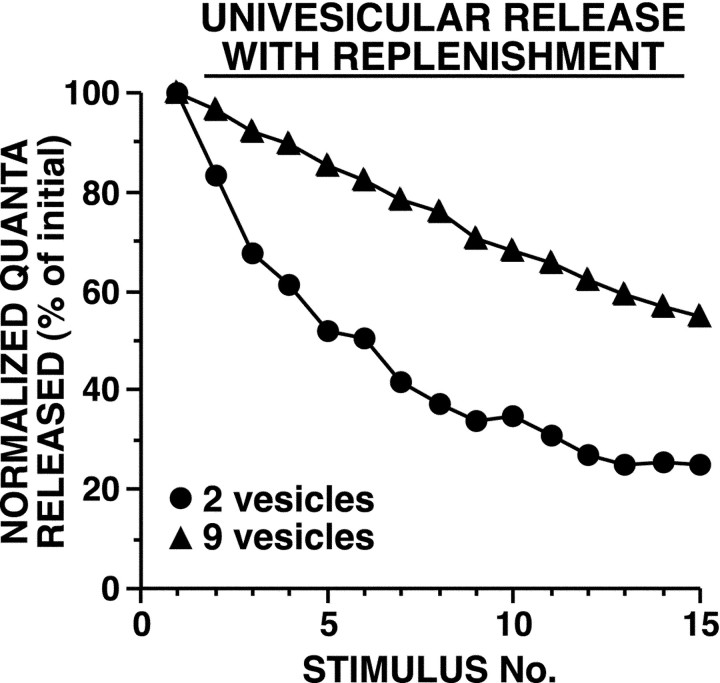
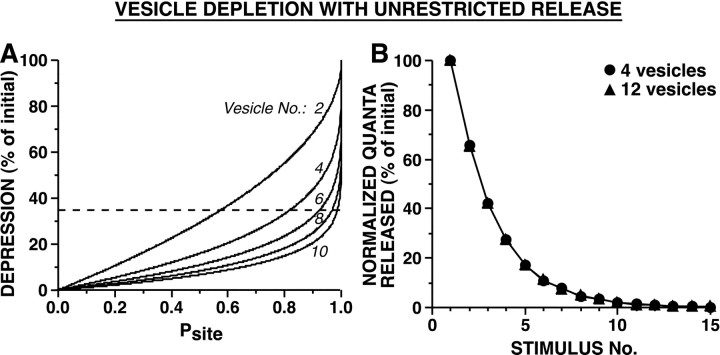
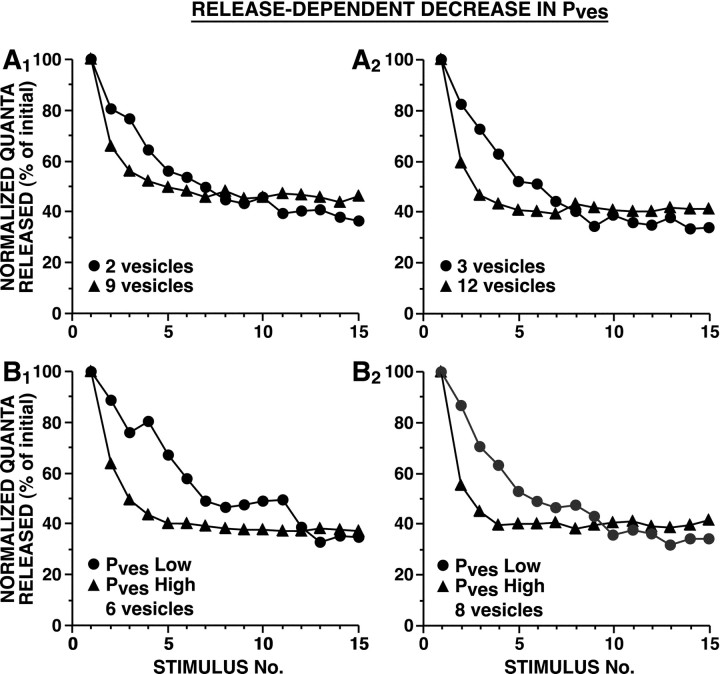
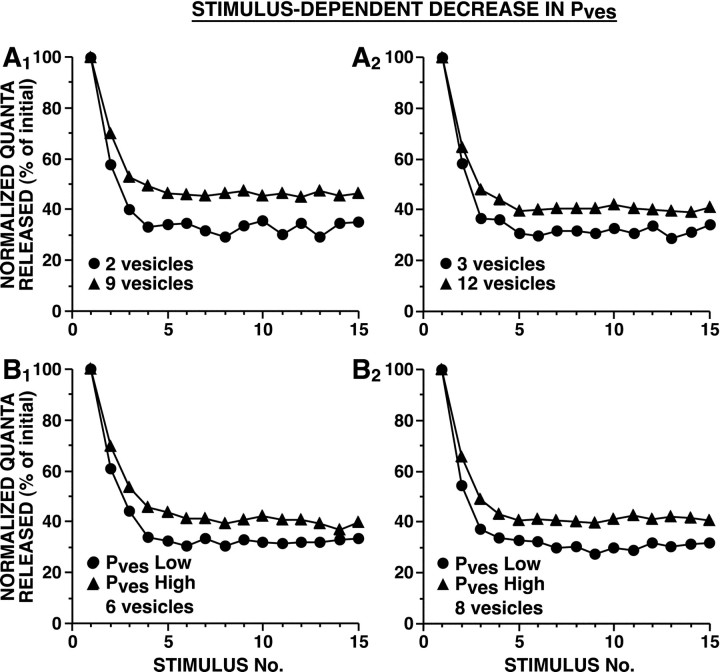
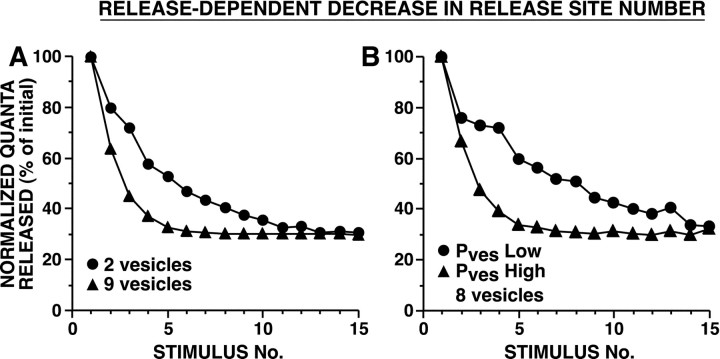
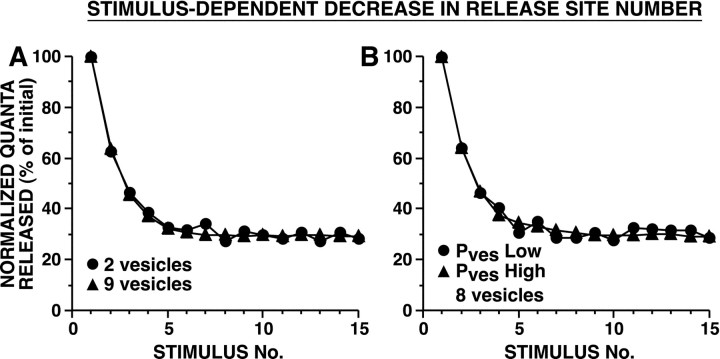
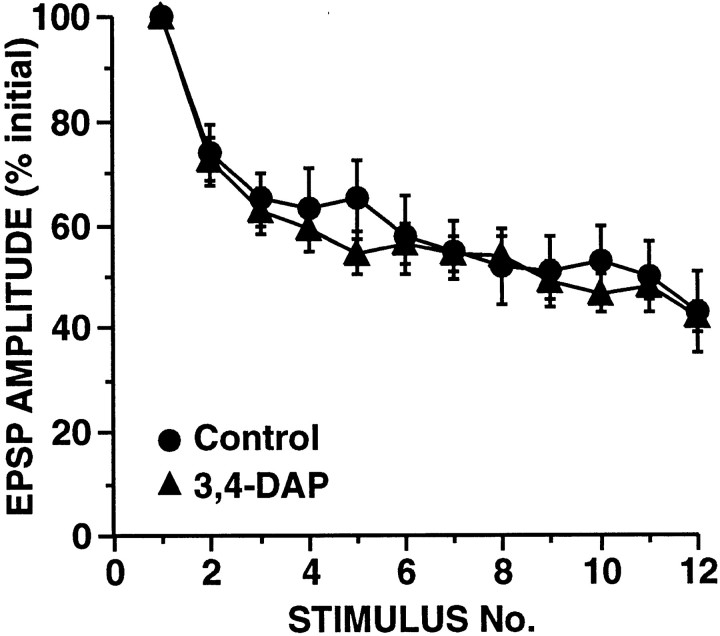
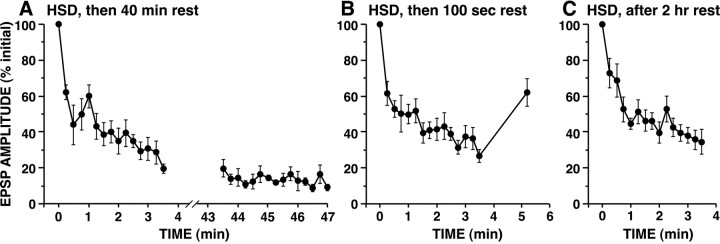
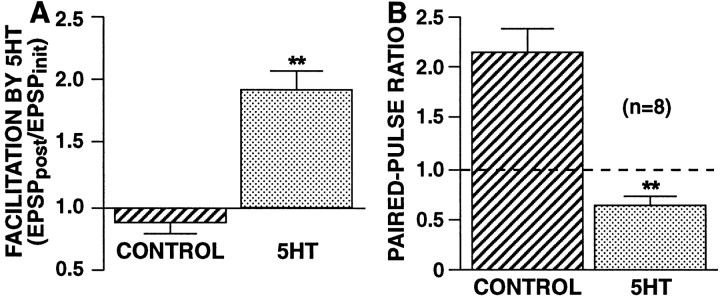
The synaptic connections of Aplysia sensory neurons (SNs) undergo dramatic homosynaptic depression (HSD) with only a few low-frequency stimuli. Strong and weak SN synapses, although differing in their probabilities of release, undergo HSD at the same rate; this suggests that the major mechanism underlying HSD in these SNs may not be depletion of the releasable pool of vesicles. In computational models, we evaluated alternative mechanisms of HSD, including vesicle depletion, to determine which mechanisms enable strong and weak synapses to depress with identical time courses. Of five mechanisms tested, only release-independent, stimulus-dependent switching off of release sites resulted in HSD that was independent of initial synaptic strength. This conclusion that HSD is a release-independent phenomenon was supported by empirical results: an increase in Ca2+ influx caused by spike broadening with a K+ channel blocker did not alter HSD. Once induced, HSD persisted during 40 min of rest with no detectable recovery; thus, release does not recover automatically with rest, contrary to what would be expected if HSD represented an exhaustion of the exocytosis mechanism. The hypothesis that short-term HSD involves primarily a stepwise silencing of release sites, rather than vesicle depletion, is consistent with our earlier observation that HSD is accompanied by only a modest decrease in release probability, as indicated by little change in the paired-pulse ratio. In contrast, we found that there was a dramatic decrease in the paired-pulse ratio during serotonin-induced facilitation; this suggests that heterosynaptic facilitation primarily involves an increase in release probability, rather than a change in the number of functional release sites.


Figures

Fig. 1.
Fig. 1.
Dependence of release site probability (Psite) on the number of releasable vesicles and the probability of release of individual vesicles.A,Psite as a function of the number of readily releasable vesicles (n). In this graph, the probability of release of individual vesicles (Pves) was selected to achieve aPsite of 0.9 with 10 releasable vesicles.B,Psite as a function ofPves for different values ofn. C, NormalizedPsite as a function ofPves for different values ofn. Normalized Psite equals 100 times Psite divided by the maximumPsite for each curve (Psite is at a maximum in these curves whenPves equals 0.0024). In bothB and C, n = 2, 4, 6, 8, and 10. Note that the curves for different values ofn are not parallel. In A, the nonlinear curve indicates why, as n decreases with depletion, synapses with relatively large releasable pools are less affected than synapses with relatively small releasable pools. InB and C, the nonparallel curves illustrate why, as Pves decrements (by a given percentage) through repeated synaptic activation, there is a smaller impact on Psite whenPves or n is initially large than when Pves or n is initially small. [The relationship betweenPsite and Pvesdepends on the sampling interval (δt) becausePves is the per vesicle release probability for a single sampling interval; however, the qualitative relationship is independent of δt; in these curves, δt = 0.01 msec].
Fig. 2.
Fig. 2.
Strong and weak SN-to-MN synaptic connections undergo HSD with an identical time course, but differ in their paired-pulse ratios. A, B, Synapses were depressed by stimulating siphon SNs in the abdominal ganglion to fire single action potentials at a 15 sec interstimulus interval (ISI).A, Examples of HSD at a weak synapse (A1, initial amplitude = 3.2 mV) and a strong synapse (A2, initial amplitude = 12.5 mV). EPSPs are shown for the first, fifth, and eleventh stimuli. B, Group data on HSD for strong and weak synapses. Synaptic connections are grouped according to initial EPSP amplitudes as either strong (>8 mV) or weak (<8 mV) (mean EPSP on trial 1, 22.3 ± 2.1,n = 25, for strong synapses and 5.7 ± 0.3 mV,n = 10, for weak synapses). There was no significant difference in the time course of HSD between the two groups of synapses (repeated measure ANOVA testing interaction between initial EPSP amplitude and trial number,F(9,24) = 1.08, p = 0.42). In each experiment, EPSP amplitude is normalized to the amplitude of the EPSP on trial 1. Mean amplitude of all the EPSPs on trial 12 was 36 ± 3% of the initial amplitude. C,The inverse relationship between paired-pulse ratio and initial EPSP amplitude. Curve is hyperbolic function from Jiang and Abrams (1998), which was fit to empirical paired-pulse ratios for nondepressed SN synapses. Note, that, in contrast to initially weak synapses, initially strong synapses show relatively little paired-pulse facilitation, suggesting that these stronger synapses have higher release site probabilities. D, At weak synapses, increasing Ca2+ influx by broadening the SN spike eliminates paired-pulse facilitation. For control and 4-AP-treated synapses, after a weak synaptic connection was identified, ganglia were superfused with high divalent saline, with or without 2 mm 4-AP, for 15 min, and then tested with paired-pulse stimulation. With 4-AP, SN action potentials broadened 2.9 ± 0.23-fold, and initially weak connections (<8 mV EPSPs) increased 2.08 ± 0.31-fold (to >8 mV), and displayed no paired-pulse facilitation; the paired-pulse ratio was significantly different between the two groups (∗p < 0.02). Mean EPSP1 = 4.78 ± 2.17 mV for controls and 10.64 ± 1.53 mV for 4-AP, respectively. C,D, Each synapse was tested with paired-pulse stimulation (ISI, 50 msec) only once because of lability of paired-pulse facilitation at these synapses; thus, paired-pulse ratios for control and 4-AP were from different synapses in the same ganglia (n represents the number of ganglia). (For synapses treated with 4-AP, the strength of the synapse was measured with a single spike before the application of 4-AP; once 4-AP was applied, the synapses were not activated before the paired-pulse test.)
Fig. 3.
Fig. 3.
Simulated HSD as a result of vesicle depletion when strong and weak synapses differ in their initial number of readily releasable vesicles. During each simulation,Pves and Nsiteremained constant. A, B, Univesicular release, in which after an initial vesicle release event at a release site, further release was blocked for 5 msec. C,D, Limited multivesicular release, in which after an initial release event, Psite, δt was reduced by a factor of 0.66 and then recovered exponentially with a time constant of 3 msec.Pves was selected to achieve aPsite of 0.9 with 10 releasable vesicles (A) or with 20 releasable vesicles (B); in C and D,Pves values were the same as inA and B, respectively. Average initial number of quanta released were: for A, 14.8 for 2 vesicles and 35.0 for 9 vesicles; for B, 11.4 for 3 vesicles and 32.6 for 15 vesicles; for C, 15.1 for 2 vesicles and 51.5 for 9 vesicles; and for D, 12.0 for 3 vesicles and 45.9 for 15 vesicles. In other simulation experiments,Pves values were twofold and fourfold smaller; with these lower Pves values, strong and weak synapses still depressed at different rates, although with the smallest Pves values tested, HSD was extremely modest because minimal depletion occurred. Note that strong synapses underwent HSD at a slower rate than weak synapses [repeated measure ANOVA testing interaction between vesicle number and trial number: (A)F(14,145) = 139, p< 0.001; (B)F(14,145) = 68, p< 0.001; (C)F(14,145) = 26, p< 0.001; and (D)F(14,145) = 9.5, p< 0.001]. Sampling interval was 0.01 msec.
Fig. 4.
Fig. 4.
Simulated HSD as a result of vesicle depletion when strong and weak synapses differ in the release probability of individual vesicles. During each simulation,Pves and Nsiteremained constant. A, Univesicular release.B, Limited multivesicular release (as in Fig.3C,D). Pves inA was selected to achieve aPsite of 0.25 and 0.75 forPves Low and PvesHigh, respectively, with six releasable vesicles; the samePves values were used in B. Average initial number of quanta released were: for A, 11.0 for Pves Low and 29.7 forPves High; and for B, 11.6 for Pves Low and 37.6 forPves High. Strong synapses underwent HSD at a faster rate than weak synapses [repeated measure ANOVA testing interaction between vesicle number and trial number: (A) F(14,145) = 43, p < 0.001; (B)F(14,145) = 54, p< 0.001]. Sampling interval was 0.01 msec.
Fig. 5.
Fig. 5.
Simulated HSD at synapses with heterogeneous release site properties. To assess whether the linear time course of HSD observed with vesicle depletion models was a consequence of the specific parameters chosen, we created models where these parameters varied widely among active zones. During each simulation,Pves and Nsiteremained constant. Each of 10 release sites (of 40 total) had 3, 8, 12, or 20 vesicles initially. Pves was randomly assigned to each release site at the beginning of each simulation;Pves varied within a threefold range up to a maximum value that produced a Psite of 0.9 with nine releasable vesicles. With this and all other vesicle depletion models tested, HSD developed with a nonexponential time course. Sampling interval was 0.25 msec.
Fig. 6.
Fig. 6.
Simulated HSD as a result of vesicle depletion with replenishment, when strong and weak synapses differ in their initial number of readily releasable vesicles. Vesicle replenishment occurred with a time constant of 150 sec [this time constant was calculated based on the apparent “recovery” of the depressed EPSP by ∼48% after 100 sec of rest (Fig. 13C)]. During each simulation, Pves andNsite remained constant.Pves was selected to achieve aPsite of 0.9 with 10 releasable vesicles; release was univesicular. Average initial number of quanta released were 15.2 for two vesicles and 35.4 for nine vesicles. Strong synapses underwent HSD at a slower rate than weak synapses [repeated measure ANOVA testing interaction between vesicle number and trial number:F(14,145) = 129, p< 0.001]. Sampling interval was 0.01 msec.
Fig. 7.
Fig. 7.
Simulated HSD as a result of vesicle depletion with unrestricted multivesicular release when strong and weak synapses differ in the initial number of readily releasable vesicles. In these models, release of each vesicle is an independent event, so that subsequent release at a release site is unaffected by previous vesicle release events. A, Relationship between amount of depression after the first stimulus andPsite for release sites with different numbers of releasable vesicles (n = 2, 4, 6, 8, and 10). Broken line corresponds to 35% HSD, the approximate amount of depression observed by Jiang and Abrams (1998)after the first stimulus, to indicate thePsite required, for a givenn, to achieve this amount of HSD. Note that to produce depression of 35% with the first stimulus,Psite must be 0.82 for release sites with 4 vesicles and >0.9 for release sites with ≥6 vesicles.B, Strong and weak synapses undergo HSD at identical rates when there is unrestricted multivesicular release.Pves was selected so that the first stimulus released 35% of the releasable pool, producing an initial HSD of 35% (with unrestricted release, althoughPsite varies as a function ofn, for a given Pves the percentage of vesicles released is constant).Psite was 0.82 and 0.99 with 4 and 12 releasable vesicles, respectively. Average initial number of quanta released were: 56.1 for 4 vesicles and 168.3 for 12 vesicles. There was no significant difference in the time course of HSD between strong and weak synapses (repeated measure ANOVA testing interaction between vesicle number and trial number,F(14,145) = 0.62, p= 0.84). Sampling interval was 0.01 msec.
Fig. 8.
Fig. 8.
Simulated HSD as a result of release-dependent decrement of Pves. In these two models, Pves at each release site decremented exponentially each time there was a release event at that site. During each simulation, n andNsite remained constant. InA, strong and weak synapses differed in the number of releasable vesicles. In B, strong and weak synapses differed in the initial Pves. InA, Pves was selected to achieve a Psite of 0.9 with 10 (A1) or 20 (A2) releasable vesicles. InB, Pves was selected to achieve a Psite of 0.25 and 0.75 forPves Low and Pves High, respectively, with six (B1) or eight (B2) releasable vesicles; in this figure and Figures 9-11, we chose the exponential parameters for an intermediate strength synapse to approximately match the empirical HSD; nevertheless, the simulated HSD curves for strong and weak synapses differed from one another, and from the expected exponential because the decrement inPves occurred as a function of synaptic strength. [Because these studies were initiated before the analysis of the data shown in Figure 1, all simulations were fit to the earlier published data of Jiang and Abrams (1998).] Average initial number of quanta released were: for A1, 12.4 for 2 vesicles and 35.0 for 9 vesicles; for A2, 9.6 for 3 vesicles and 27.5 for 12 vesicles; for B1, 6.6 forPves Low and 22.7 forPves High; and for B2, 10.0 for Pves Low and 30.3 forPves High. The time course of HSD was significantly different between strong and weak synapses [repeated measure ANOVA testing interaction between vesicle number and trial number: (A1) F(14,145) = 16, p < 0.001; (A2)F(14,145) = 13, p< 0.001; repeated measure ANOVA testing interaction betweenPves and trial number: (B1)F(14,145) = 11, p< 0.001; and (B2)F(14,145) = 16, p< 0.001]. Sampling interval was 0.25 msec.
Fig. 9.
Fig. 9.
Simulated HSD as a result of stimulus-dependent decrement of Pves. In these models, Pves at each release site decremented exponentially each time there was a presynaptic action potential. During each simulation, n andNsite remained constant. InA, strong and weak synapses differed in the number of releasable vesicles. In B, strong and weak synapses differed in the initial Pves. InA, Pves was selected to achieve a Psite of 0.9 with 10 (A1) or 20 (A2) releasable vesicles; inB, Pves was selected to achieve a Psite of 0.25 and 0.75 forPves Low and PvesHigh, respectively, with 6 (B1) or 8 (B2) releasable vesicles. Average initial number of quanta released were: for A1, 12.1 for 2 vesicles and 34.5 for 9 vesicles; forA2, 9.5 for 3 vesicles and 28.1 for 12 vesicles; forB1, 10.1 for Pves Low and 30.4 for Pves High; and forB2, 10.5 for Pves Low and 30.0 for Pves High. The time course of HSD was significantly different between strong and weak synapses [repeated measure ANOVA testing interaction between vesicle number and trial number: (A1) F(14,145) = 9.6, p < 0.001; (A2)F(14,145) = 2.0, p= 0.021; repeated measure ANOVA testing interaction betweenPves and trial number: (B1)F(14,145) = 3.3, p< 0.001; and (B2)F(14,145) = 5.2, p< 0.001]. Sampling interval was 0.25 msec.
Fig. 10.
Fig. 10.
Simulated HSD as a result of release-dependent decrement in release site number. In these models, release sites had a fixed probability of switching to an inactive state after a release event. During each simulation, n andPves remained constant. In A, strong and weak synapses differed in the number of releasable vesicles. In B, strong and weak synapses differed in the initialPves. In A,Pves was selected to achieve aPsite of 0.9 with 10 releasable vesicles; inB, Pves was selected to achieve a Psite of 0.25 and 0.75 forPves Low and PvesHigh, respectively, with 8 releasable vesicles. Average initial number of quanta released were: for A, 18.0 for two vesicles and 39.0 for nine vesicles; for B, 10.1 forPves Low and 29.4 forPves High. The time course of HSD was significantly different between strong and weak synapses; [(A) repeated measure ANOVA testing interaction between vesicle number and trial number:F(14,145) = 18, p< 0.001; (B) repeated measure ANOVA testing interaction between Pves and trial number:F(14,145) = 12, p< 0.001]. Sampling interval was 0.25 msec.
Fig. 11.
Fig. 11.
Simulated HSD as a result of stimulus-dependent decrement in release site number. In these models,Nsite decremented exponentially with each presynaptic action potential. During each simulation, nand Pves remained constant. InA, strong and weak synapses differed in the number of releasable vesicles. In B, strong and weak synapses differed in the initial Pves. InA, Pves was selected to achieve a Psite of 0.9 with 10 releasable vesicles; in B, Pves was selected to achieve a Psite of 0.25 and 0.75 for Pves Low andPves High, respectively, with 8 releasable vesicles. Average initial number of quanta released were: forA, 11.8 for two vesicles and 34.2 for nine vesicles; forB, 9.6 for Pves Low and 29.2 for Pves High. There was no significant difference in the time course of HSD between strong and weak synapses; [(A) repeated measure ANOVA testing interaction between vesicle number and trial number:F(14,145) = 1.5, p= 0.13. (B) repeated measure ANOVA testing interaction between Pves and trial number:F(14,145) = 1.3, p= 0.19]. Sampling interval was 0.25 msec.
Fig. 12.
Fig. 12.
Increasing release by broadening the SN action potential with the K+ channel blocker 3,4-DAP does not affect the rate of HSD. Superfusing abdominal ganglia with 5 μm 3,4-DAP before and during experiments resulted in an ∼2.95-fold increase in the duration of the SN action potential. Although no comparisons were made within preparations, on average, EPSP amplitude increased ∼50% in 3,4-DAP-treated ganglia (n = 17) as compared with in control ganglia (n = 12). [This is a smaller increase than expected (Sugita et al., 1997); however, given the wide (more than sixfold) range of initial EPSP amplitudes, it is not possible to obtain an accurate measure of the effect of spike broadening without within-cell comparisons.] Note that with broadened SN spikes, there was no significant difference in the rate of HSD (repeated measure ANOVA testing interaction between 3,4-DAP and trial number:F(9,11) = 1.1, p = 0.45).
Fig. 13.
Fig. 13.
Limited recovery of depressed SN synaptic connections with rest. A, SN synaptic connections that were rested 40 min after induction of HSD. SNs were activated 15 times. After the 15th stimulus, synapses were rested 40 min and again stimulated repetitively. Note, there was no apparent recovery of depressed SN connections. Note also that no additional HSD was induced by the subsequent stimulation after rest. B,After HSD develops at SN synapses, EPSPs show partial recovery after a 100 sec period of rest. After the 15th stimulus, synapses were rested 100 sec and then SNs were stimulated once more. C,Prolonged incubation in culture medium does not interfere with the expression of HSD at SN synapses. Abdominal ganglia were superfused for 2 hr in culture medium before SN synapses were stimulated 15 times. In all three protocols during the series of 15 stimuli, the ISI was 15 sec. [Although the increase in EPSP amplitude after 100 sec of rest inB does not represent actual recovery of the synapse to the initial naive state, we used this percentage of recovery as an estimate of the time constant of replenishment for models that included vesicle recycling (Fig. 6).]
Fig. 14.
Fig. 14.
Facilitation by 5-HT is accompanied by a large decrease in the paired-pulse ratio. Within each ganglion (n = 8), paired-pulse ratios were measured at SN-to-MN synapses in control saline and in the presence of 20 μm 5-HT. Because the paired-pulse ratio decrements sharply with testing (Jiang and Abrams, 1998), the paired-pulse ratio was tested only once per synapse; comparisons were made between separate synapses recorded either in control saline or in 5-HT saline within each ganglion. Control measurements were made before measurements in 5-HT. Each synapse was first tested with a single stimulus and then tested 15 min later with paired stimuli. For 5-HT-induced facilitation, superfusion with 20 μm 5-HT was begun 2.5 min before the paired test. A,Facilitation by 5-HT. The ratio of the EPSP produced by the first of the two paired stimuli (in either 5-HT or control saline) (EPSPpost) to the initial EPSP recorded 15 min before the paired test (EPSPinit). B,Paired-pulse ratios measured in control saline or 5-HT saline. Paired stimuli were at a 50 msec ISI. Initial EPSP amplitudes (recorded in control saline) were 8.53 ± 1.6 mV for synapses that were subsequently tested in control saline and 9.74 ± 2.7 mV for synapses that were subsequently tested in 5-HT (difference not significant). Both 5-HT-induced facilitation and the decrease in the paired-pulse ratio with 5-HT exposure were highly significant (**p < 0.002; two-tailed paired ttest).

References

    1. Abbott LF, Varela JA, Sen K, Nelson SB. Synaptic depression and cortical gain control. Science. 1997;275:220–224. - PubMed
    1. Adler EM, Augustine GJ, Duffy SN, Charlton MP. Alien intracellular calcium chelators attenuate neurotransmitter release at the squid giant synapse. J Neurosci. 1991;11:1496–1507. - PMC - PubMed
    1. Armitage BA, Siegelbaum SA. Presynaptic induction and expression of homosynaptic depression at Aplysia sensorimotor neuron synapses. J Neurosci. 1998;18:8770–8779. - PMC - PubMed
    1. Auger C, Kondo S, Marty A. Multivesicular release at single functional synaptic sites in cerebellar stellate and basket cells. J Neurosci. 1998;18:4532–4547. - PMC - PubMed
    1. Bailey CH, Chen M. Morphological basis of long-term habituation and sensitization in Aplysia. Science. 1983;220:91–93. - PubMed

Publication types

MeSH terms

LinkOut - more resources