. 2002 Mar 1;22(5):1976-84.
doi: 10.1523/JNEUROSCI.22-05-01976.2002.

Dynamics of spatial frequency tuning in macaque V1

Affiliations

Dynamics of spatial frequency tuning in macaque V1

C E Bredfeldt et al. J Neurosci. .

Abstract

Spatial frequency tuning in the lateral geniculate nucleus of the thalamus (LGN) and primary visual cortex (V1) differ substantially. LGN responses are largely low-pass in spatial frequency, whereas the majority of V1 neurons have bandpass characteristics. To study this transformation in spatial selectivity, we measured the dynamics of spatial frequency tuning using a reverse correlation technique. We find that a large proportion of V1 cells show inseparable responses in spatial frequency and time. In several cases, tuning becomes more selective over the course of the response, and the preferred spatial frequency shifts from low to higher frequencies. Many responses also show suppression at low spatial frequencies, which correlates with the increases in response selectivity and the shifts of preferred spatial frequency. These results indicate that suppression plays an important role in the generation of bandpass selectivity in V1.


Figures

Fig. 1.
Fig. 1.
Reverse correlation in the spatial frequency domain. Each stimulus in the sequence is a sinusoidal grating with 1 of 11–19 possible spatial frequencies equally spaced logarithmically. A blank stimulus is randomly interleaved in the sequence to provide a measure of baseline activity. The spikes in the response sequence are correlated with the spatial frequencies of the images that preceded them by τ msec. We perform this calculation for a range of τ values from 0 to 150 msec.
Fig. 2.
Fig. 2.
Analysis of the dynamics of spatial frequency tuning. A, Plot of the variance of response for one example. The short vertical line indicates τ = 20 msec. Thedashed line indicates the criterion level for a significant response. B, Plot of the maximum (thick line) and minimum (thin line) amplitudes, Mx(τ) and Mn(τ), respectively, of a sample dynamic spatial frequency tuning response as a function of τ. τmax and τmin indicate the time delays that produced the largest response enhancement and the most suppression, respectively. Thedashed line indicates 50% of the maximum response. Theintersection of this line with the thick curve indicates the half point of development (τdev) and the half point of decay (τdecay) of the response. C, Example of a typical response at a single time-slice. fpkindicates the peak spatial frequency of the response. flow and fhigh mark the low and high spatial frequency cutoffs. Areas of the curve below 0, shaded with vertical lines, indicate suppression of the response of the cell, whereas points on the curve above 0, shaded withhorizontal lines, indicate enhancement of the response of the cell. τ is shown in the top right of the graph. D, Best fitting model components for the response in C. The solid and dashed lines indicate the spatial frequency tuning of the excitatory and inhibitory inputs to the model, respectively. The gray shading indicates the area of overlap between the two inputs (Eq. 13).
Fig. 3.
Fig. 3.
Examples of dynamic spatial frequency tuning curves. A, Example of a response that increases in selectivity over time. The increase in selectivity is accompanied by lagged suppression at low spatial frequencies. The peak of the tuning curve shifts from 0.72 cpd at 36 msec to 2.63 cpd at 72 msec. B, Example of a tuning curve that is initially low-pass (at τ = 42 msec) and becomes bandpass over time. The peak of the tuning curve shifts from 1.51 cpd at 34 msec to 4.3 cpd at 74 msec. C, This response shows no change in selectivity or preferred spatial frequency and little to no response suppression. D–F, Selectivity as a function of τ, for the three example cells shown in A–C. Selectivity is measured by the Q-factor (Eq. 8). G–I, Preferred spatial frequency, fpk, as a function of τ, for the three example cells shown in A–C.
Fig. 4.
Fig. 4.
Preferred spatial frequency of dynamic tuning. A, Histogram of the preferred spatial frequency ( fpk) of the time-averaged response of each cell. B, Change of preferred spatial frequency over the time course of their response. Positive numbers indicate a shift from low to high spatial frequencies, whereas negative numbers indicate a shift from high to low spatial frequencies.
Fig. 5.
Fig. 5.
Selectivity of dynamic spatial frequency tuning. A, Histogram of the selectivity of the time-averaged responses. We use the Q-factor to estimate selectivity. B, Scatter plot of the selectivity index measured at τdevversus τdecay. The dashed line indicates the unit line, at which Q(τdev) equals Q(τdecay). C, Comparison of the change in steepness over time of the low spatial frequency limb of the tuning curve versus the high spatial frequency limb of the curve.
Fig. 6.
Fig. 6.
Properties of suppression. A, Histogram of the overall amount of response suppression relative to response enhancement. Values near 0 indicate that there was very little suppression relative to the amount of response enhancement; values near 1 would indicate an almost pure suppressive response. B, Histogram of the relative location of maximal response enhancement versus response suppression (Eq. 12). Positive values indicate that the center spatial frequency of response enhancement was higher than the center spatial frequency of suppression.
Fig. 7.
Fig. 7.
Example of the model components and fit for the response shown in Figure 3A. A, Spatial profile of the excitatory (solid line) and inhibitory (dashed line) input components fit by our model. B, Temporal profile of the components. C, Response and fit at three time points (τdev, τmax, and τdecay). At τdecay, the response is clearly suppressed for low spatial frequencies.
Fig. 8.
Fig. 8.
Distribution of model parameters. A, Scatter plot of the center spatial frequency of the excitatory (fctr(E)) and suppressive components (fctr(I)), on a log–log axis. The histogram indicates the log ratio of fctr(E) and fctr(I) and shows that fctr(E) is higher than fctr(I) for most responses. B, Scatter plot of the ς of the excitatory (ς(E)) and inhibitory (ς(I)) components. The histogram indicates the difference between ς(E) and ς(I).
Fig. 9.
Fig. 9.
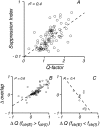
Effect of suppression on selectivity. A, The time-averaged selectivity of dynamic tuning increases with increasing suppression. B, C, The change in selectivity over the time course of the response (ΔQ) is related to a change in the amount of overlap between the two components of the model (Δoverlap). Positive numbers on theabscissa indicate an increase in selectivity over time, whereas negative numbers indicate a decrease in selectivity. On the ordinate, positive numbers indicate increasing amounts of overlap between the components over time.
Fig. 10.
Fig. 10.
Effect of suppression on fpk. A, B, There is a correlation between Δfpk and Δoverlap. The form of this relationship is similar to the relationship seen between the change in selectivity and the change in overlap (Fig. 9).

References

    1. Adorjan P, Levitt JB, Lund JS, Obermayer K. A model for the intracortical origin of orientation preference and tuning in macaque striate cortex. Vis Neurosci. 1999;16:303–318. - PubMed
    1. Anderson JS, Carandini M, Ferster D. Orientation tuning of input conductance, excitation, and inhibition in cat primary visual cortex. J Neurophysiol. 2000;84:909–926. - PubMed
    1. Bauman LA, Bonds AB. Inhibitory refinement of spatial frequency selectivity in single cells of the cat striate cortex. Vision Res. 1991;31:933–944. - PubMed
    1. Benevento LA, Creutzfeldt OD, Kuhnt U. Significance of intracortical inhibition in the visual cortex. Nat New Biol. 1972;238:124–126. - PubMed
    1. Ben-Yishai R, Bar-Or RL, Sompolinsky H. Theory of orientation tuning in visual cortex. Proc Natl Acad Sci USA. 1995;92:3844–3848. - PMC - PubMed

Publication types

LinkOut - more resources