. 2002 Mar 1;22(5):2012-21.
doi: 10.1523/JNEUROSCI.22-05-02012.2002.

Local generation of fast ripples in epileptic brain

Affiliations

Local generation of fast ripples in epileptic brain

Anatol Bragin et al. J Neurosci. .

Abstract

Aperiodic high-frequency oscillations (>100 Hz) reflect a short-term synchronization of neuronal electrical activity. It has been shown in the epileptic brain that spontaneous oscillations in the frequency range of 250-600 Hz reflect action potential population bursts of synchronously discharging neuronal clusters. These oscillations occur in the early stages of epileptogenesis in areas adjacent to the brain lesion and may trigger the formation of seizure-generating neuronal networks. We studied the extent of the area generating oscillations in the frequency range of 250-600 Hz [fast ripples (FRs)] in intrahippocampal kainic acid-treated rats with spontaneous seizures, by analyzing voltage versus depth profiles of FRs in hippocampal and parahippocampal areas in freely moving animals and by spatial mapping in hippocampal slice preparations in vitro. The strength of inhibition was compared in areas with and without FRs using a paired-pulse paradigm. The extent of the areas generating FRs did not exceed 1 mm(3). The areas generating FRs became broader after the application of the GABA(A) receptor antagonist bicuculline. Paired-pulse fast inhibition at 15-30 msec intervals was similar in areas generating FRs and areas not generating FRs. Our data illustrate that hypothesized clusters of highly interconnected neurons are capable of overcoming interneuron feedback inhibition, resulting in generation of epileptiform bursts, eventually leading to seizure activity.


Figures

Fig. 1.
Fig. 1.
A, An example of FRs recorded simultaneously in the dentate gyrus and entorhinal cortex of an epileptic rat 4 months after kainic acid injection in the CA3 area of the posterior hippocampus. B, Averaged power spectra of FRs in the DG (top) and EC (bottom) of six rats (in square millivolts, here and in other figures). Gray lines illustrate SEM.
Fig. 2.
Fig. 2.
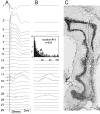
A, Voltage–depth profiles of potentials recorded at 100 μm intervals in response to perforant path stimulation. Note that FRs are evoked only at sites 18,19, and 24. Recordings are averages of five stimulations at each side. B, Spontaneous FRs could be recorded only at the same sites as in A:18, 19, and 24 (average of 5 in each trial). Inset illustrates distribution of spontaneous FRs (n = 425 FR events) recorded at location 19 during a period of 120 min.Arrow indicates mean inter-FR interval.C, Track of the microelectrode in a Nissl-stained coronal section of the posterior curve of the hippocampus, showing the dorsoventral extent of the dentate gyrus. Arrowsindicate the beginning and the end the recording area.Stars indicate sites at which FRs were recorded. Scale bar: gray, 200 μm on the basis of histological measurement; white, 200 μm on the basis of electrophysiological measurement (for details, see Materials and Methods).
Fig. 3.
Fig. 3.
Map of evoked field potentials in the dentate gyrus slices obtained from an epileptic rat in response to perforant path (solid lines) and hilus (dashed lines) stimulation. Notice that FR-like responses are recorded at points 4, 5, and 6 in response to both perforant path and hilar stimulation. Theinset is the power spectra of the evoked responses to hilus stimulation. Each recording is the average of five responses in this and remaining figures.
Fig. 4.
Fig. 4.
Map of evoked potentials in the CA1 area of the hippocampus of an epileptic rat in response to alveus (Stim alv) and stratum radiatum (Stim rad) stimulation. Notice that FR-like responses occurred at recordingpoint3 in response to both points of stimulation. The inset is the power spectrum of the response in area 3 to alveus stimulation.
Fig. 5.
Fig. 5.
Map of evoked potentials showing FR-like responses in the deep layer of the subiculum–presubiculum area of an epileptic rat in response to deep layer stimulation. Notice that fast ripples were evoked in the deep layer of the subiculum in response to stimulation of both subicular and parasubicular electrodes. Theinset is the power spectrum of the evoked response to the st1 stimulation at point 6.
Fig. 6.
Fig. 6.
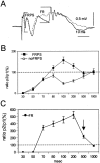
In vivo study of paired-pulse suppression of dentate gyrus population spikes in an epileptic rat in response to perforant path stimulation. A, Examples of the evoked field potentials to the conditioning (dashed line) and test (solid line) pulses delivered with an interpulse interval of 500 msec in an area generating spontaneous FRs (FRPS). B, Paired-pulse-dependent changes at interstimulus intervals from 30 to 1000 msec in the ratio of the population spike amplitude in response to the test stimulus (p2) to population spike amplitude in response to the conditioning stimulus (p1) × 100. This ratio is plotted for responses in areas not generating FRs (noFRPS;open circles) and in areas generating FRs (filled squares). C, Amplitude changes in the first spike of the FR complex (filled circles) at increasing interpulse intervals. Note that FR oscillations become augmented in response to the test pulse at interstimulus intervals of 70–500 msec.
Fig. 7.
Fig. 7.
In vitro study of paired-pulse suppression of dentate gyrus population spikes in an epileptic rat in response to perforant path stimulation. A, An example of an FR-like response to hilus stimulation with conditioning pulse (solid line) and test pulse (dashed line) delivered with 300 msec interval. #1 and#2 indicate the first and second spike in the response that were used for measurement of change in amplitude at different interpulse intervals. B, The progression of the first (open circles) and second (filled circles) spikes of FR-like responses at different interpulse intervals. noFRPS, Areas not generating FRs;FRPS, areas generating spontaneous FRs.C, The evolution of the number of spikes in the FR-like response to perforant path (PP; filled circles) and hilus (Hil; open circles) stimulation at different interpulse intervals.
Fig. 8.
Fig. 8.
A, Areas in the in vitro dentate gyrus generating FR-like responses in normal ACSF (thick lines) and after the addition of 10 μm bicuculline to the perfusate (thin lines). B, Timm's-stained section demonstrating sprouting of mossy fibers in the inner molecular layer in relation to the positions of the recording sites that were stimulated to evoke the field potentials shown in A.
Fig. 9.
Fig. 9.
A, Correlation between local and remote FRs in the dentate gyrus and entorhinal cortex. Thetop of each column represents auto-correlograms of fast ripples in each recorded site (seeinsets), and graphs below represent cross-correlograms between each of the recording sites as labeled. The left column illustrates cross-correlograms of the peak of DG1 fast ripples and fast ripples recorded at DG2, 1.5 mm away, and two similar recording sites in the EC. The next column represents cross-correlograms of the DG2 peak of fast ripples with EC. Notice that, despite the similarity of the frequency in all recording points, only the DG2 point shows coherence with fast ripples recorded in the EC. B illustrates the position of the recording microelectrodes in the dentate gyrus (left) and the EC (right). C, Perievent time histograms between FRs generated in DG and EC at longer intervals in which EC2 was used as a trigger.
Fig. 10.
Fig. 10.
Occurrence of an FR-like pattern in vivo in the response to a test pulse delivered 70 msec after the conditioning pulse (n = 5). The responses from the same electrodes as in Figure 8 are presented. Wide band recording (A) and bandpass (100–1000 Hz)-filtered (B) examples of the responses indicated in thedashed box.

References

    1. Bertram EH, Zhang DX, Mangan P, Fountain N, Rempe D. Functional anatomy of limbic epilepsy: a proposal for central synchronization of a diffusely hyperexcitable network. Epilepsy Res. 1998;32:194–205. - PubMed
    1. Bragin A, Jando G, Nadasdy Z, Hetke J, Wise K, Buzsaki G. Gamma (40–100 Hz) oscillation in the hippocampus of the behaving rat. J Neurosci. 1995;15:47–60. - PMC - PubMed
    1. Bragin A, Engel J, Jr, Wilson CL, Fried I, Mathern GW. Hippocampal and entorhinal cortex high-frequency oscillations (100–500 Hz) in human epileptic brain and in kainic acid-treated rats with chronic seizures. Epilepsia. 1999a;40:127–137. - PubMed
    1. Bragin A, Engel J, Jr, Wilson CL, Fried I, Buzsaki G. High-frequency oscillations in human brain. Hippocampus. 1999b;9:137–142. - PubMed
    1. Bragin A, Wilson CL, Engel J., Jr Chronic epileptogenesis requires development of a network of pathologically interconnected neuron clusters: a hypothesis. Epilepsia. 2000;41:S144–S152. - PubMed

Publication types

MeSH terms