. 2002 Mar 5;99(5):2708-13.
doi: 10.1073/pnas.052005699.

13C NMR isotopomer analysis reveals a connection between pyruvate cycling and glucose-stimulated insulin secretion (GSIS)

Affiliations

13C NMR isotopomer analysis reveals a connection between pyruvate cycling and glucose-stimulated insulin secretion (GSIS)

Danhong Lu et al. Proc Natl Acad Sci U S A. .

Abstract

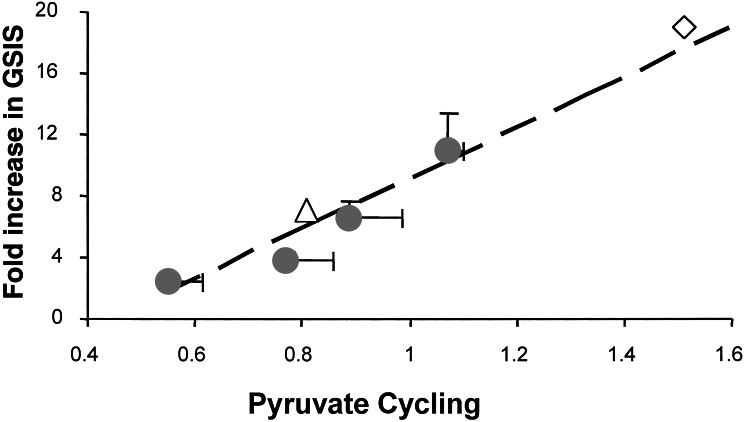
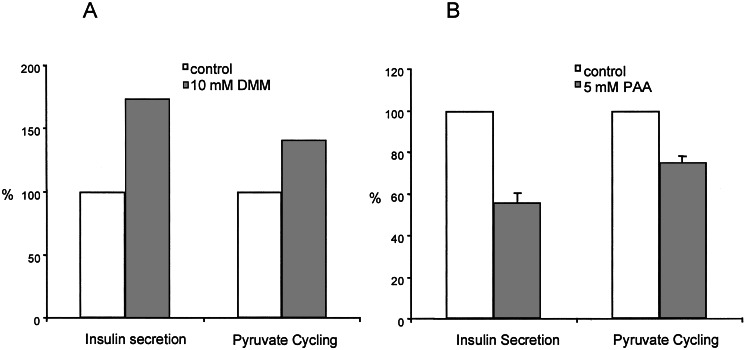
Cellular metabolism of glucose is required for stimulation of insulin secretion from pancreatic beta cells, but the precise metabolic coupling factors involved in this process are not known. In an effort to better understand mechanisms of fuel-mediated insulin secretion, we have adapted 13C NMR and isotopomer methods to measure influx of metabolic fuels into the tricarboxylic acid (TCA) cycle in insulinoma cells. Mitochondrial metabolism of [U-13C3]pyruvate, derived from [U-13C6]glucose, was compared in four clonal rat insulinoma cell 1-derived cell lines with varying degrees of glucose responsiveness. A 13C isotopomer analysis of glutamate isolated from these cells showed that the fraction of acetyl-CoA derived from [U-13C6]glucose was the same in all four cell lines (44 +/- 5%, 70 +/- 3%, and 84 +/- 4% with 3, 6, or 12 mM glucose, respectively). The 13C NMR spectra also demonstrated the existence of two compartmental pools of pyruvate, one that exchanges with TCA cycle intermediates and a second pool derived from [U-13C6]glucose that feeds acetyl-CoA into the TCA cycle. The 13C NMR spectra were consistent with a metabolic model where the two pyruvate pools do not randomly mix. Flux between the mitochondrial intermediates and the first pool of pyruvate (pyruvate cycling) varied in proportion to glucose responsiveness in the four cell lines. Furthermore, stimulation of pyruvate cycling with dimethylmalate or its inhibition with phenylacetic acid led to proportional changes in insulin secretion. These findings indicate that exchange of pyruvate with TCA cycle intermediates, rather than oxidation of pyruvate via acetyl-CoA, correlates with glucose-stimulated insulin secretion.


Figures

Figure 1
Figure 1
Modeling of pyruvate metabolism with13C isotopomer analysis. Two possible metabolic fates of [U-13C3]pyruvate (derived from [U-13C6]glucose) and the resultant modeled spectra of glutamate carbons 2 (C2) and 4 (C4) [simulated by using tcasim from (www2.swmed.edu/rogersmr/available_products.htm)]. (Top) We have assumed that [U-13C3]pyruvate enters the TCA cycle only via PDH, whereas in the Bottom, flux of [U-13C3]pyruvate through PDH and PC are equal. The 13C spectrum of glutamate clearly differentiates these two metabolic extremes.
Figure 2
Figure 2
13C NMR spectra of extracts of 832/13 cells after a 4-h incubation with [U-13C6]glucose. The robustly glucose-responsive INS-1-derived cell line 832/13 (21) was incubated with 3, 6, or 12 mM [U-13C6]glucose, followed by extraction of cellular glutamate for NMR analysis. GluC2, GluC3, and GluC4 are the resonances of carbons 2, 3, and 4 of glutamate, respectively. AspC3 is the resonance for the C3 carbon of tissue aspartate. An expanded Glu-C4 resonance from cells incubated with 12 mM glucose is shown the top of the figure. The arrows designate three small resonances (a singlet and a doublet) that could have been derived only by entry of a TCA cycle intermediate into the pyruvate pool feeding acetyl-CoA (see text). The two small arrows over the GluC2 resonance identify a doublet (D23) whose area is particularly sensitive to pyruvate cycling.
Figure 3
Figure 3
Two metabolic models used for fitting of 13C multiplet data of Fig. 2. (A) A single pyruvate pool feeds both PDH and PC. Any pyruvate derived from the TCA cycle via a catabolic decarboxylation pathway also randomly mixes with [U-13C3]pyruvate coming from [U-13C6]glucose. (B) The pyruvate pool involved in cycling with TCA cycle intermediates is sequestered in a compartment that does not allow full equilibration with [U-13C3]pyruvate coming from [U-13C6]glucose.
Figure 4
Figure 4
Linear relationship between GSIS and pyruvate cycling. The filled circles are data from INS-1-derived cell lines 832/1, 832/2, 834/40, and 832/13 INS-1 cells (ref. ; in order of increasing capacity for GSIS). The open diamond represents 832/13 cells incubated with 12 mM glucose plus 10 mM DMM, a stimulatory metabolite for pyruvate cycling. The open triangle represents 832/13 cells incubated with 12 mM glucose plus 5 mM PAA, an inhibitor of PC and pyruvate cycling.
Figure 5
Figure 5
A stimulatory substrate (DMM) and an inhibitor (PAA) of pyruvate cycling have proportional effects on insulin secretion. Insulin secretion was measured from 832/13 cells during incubation with 12 mM [U-13C6]glucose. A shows insulin secretion and pyruvate cycling in the presence and absence of 10 mM DMM. B shows insulin secretion and pyruvate cycling in the presence and absence of 5 mM PAA, an inhibitor of PC. Data represent the mean ± SE for 4 independent determinations.

References

    1. Newgard C B, McGarry J D. Annu Rev Biochem. 1995;64:689–719. - PubMed
    1. Newgard C B, Matschinsky F M. In: Handbook of Physiology. Jefferson J, Cherrington A, editors. Vol. 2. London: Oxford Univ. Press; 2001. pp. 125–152.
    1. Heimberg H, DeVos A, Vandercammen A, Van Schaftingen E, Pipeleers D, Schuit F. EMBO J. 1993;12:2873–2879. - PMC - PubMed
    1. MacDonald M J. Arch Biochem Biophys. 1995;319:128–132. - PubMed
    1. MacDonald M J, McKenzie D I, Walker T M, Kaysen J H. Horm Metab Res. 1992;24:158–160. - PubMed

Publication types