. 2002 Mar 5;99(5):2800-5.
doi: 10.1073/pnas.052704699.

Crystal structure of the yeast cytochrome bc1 complex with its bound substrate cytochrome c

Affiliations

Crystal structure of the yeast cytochrome bc1 complex with its bound substrate cytochrome c

Christian Lange et al. Proc Natl Acad Sci U S A. .

Abstract

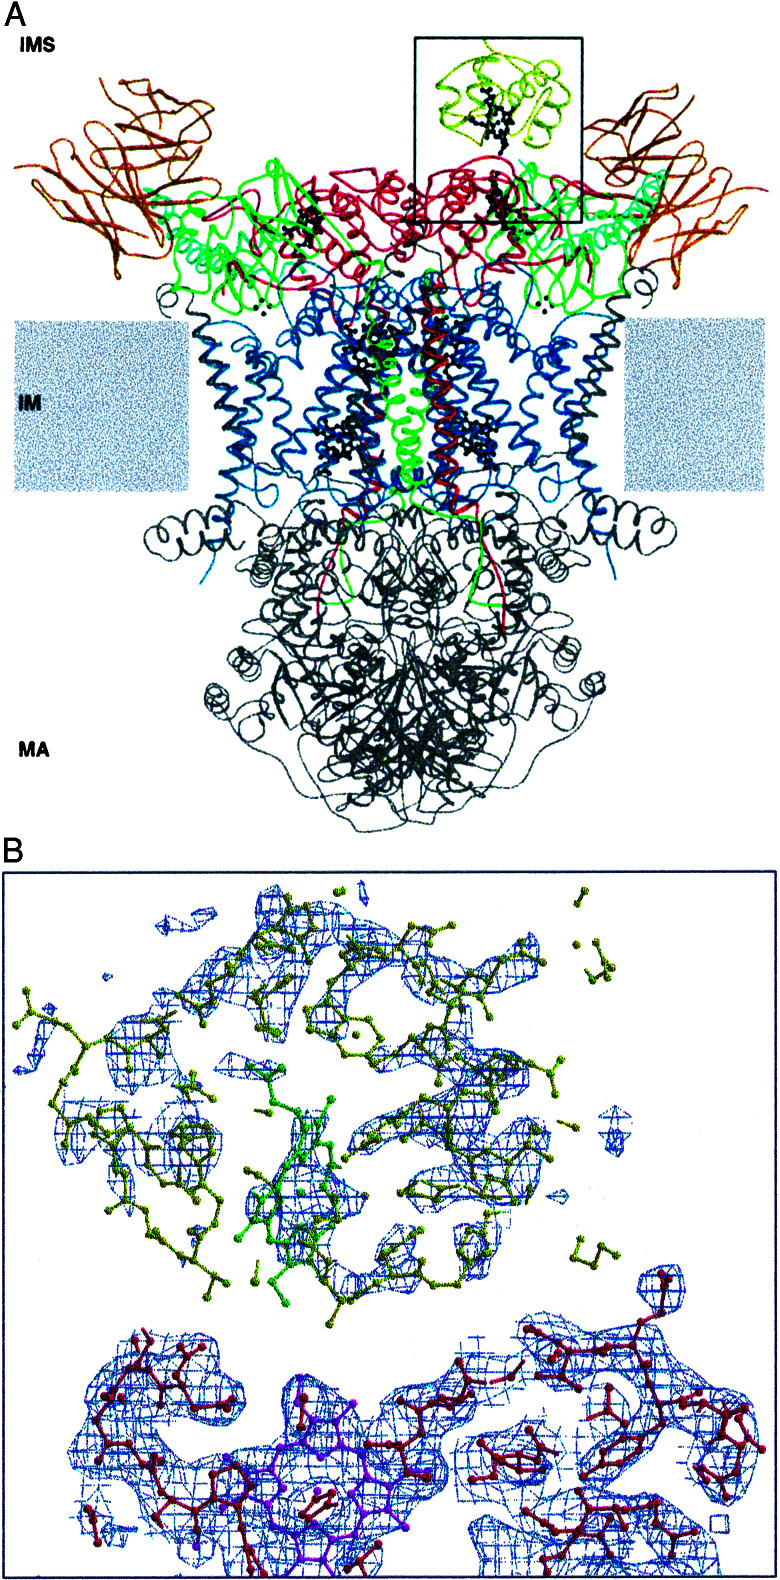
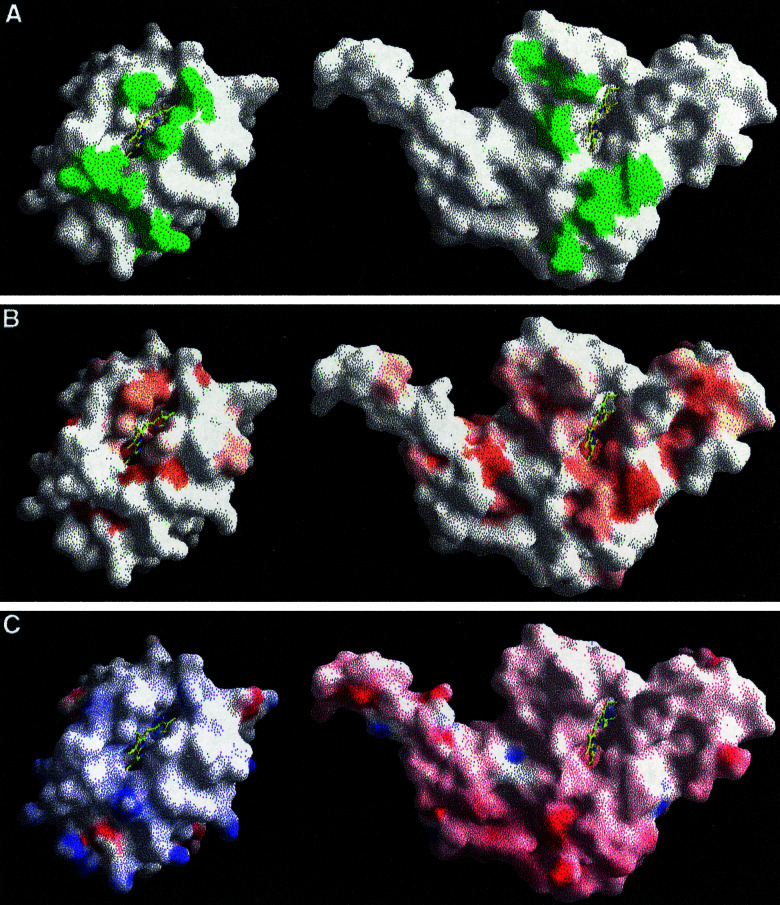
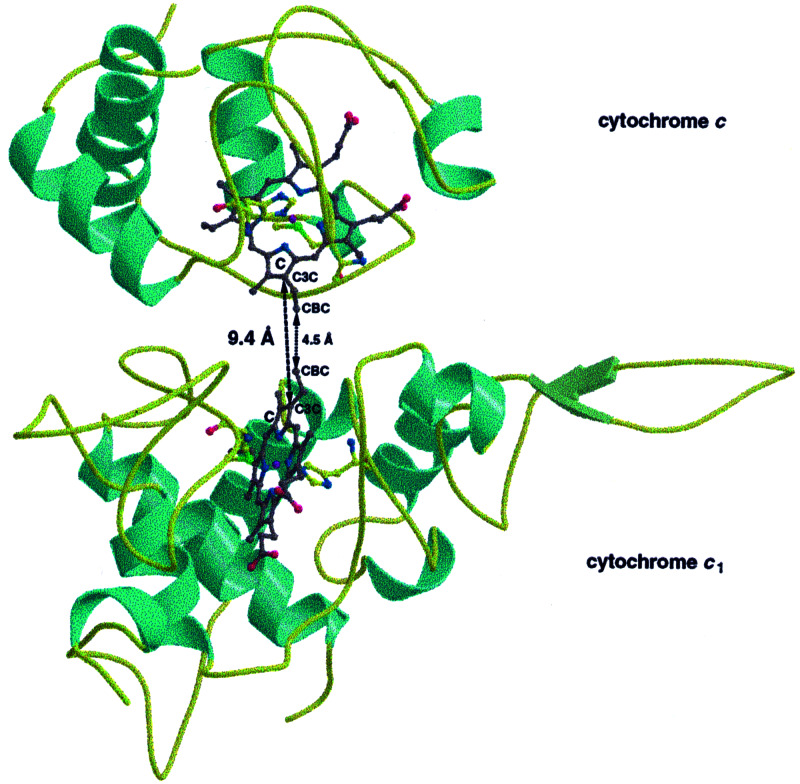
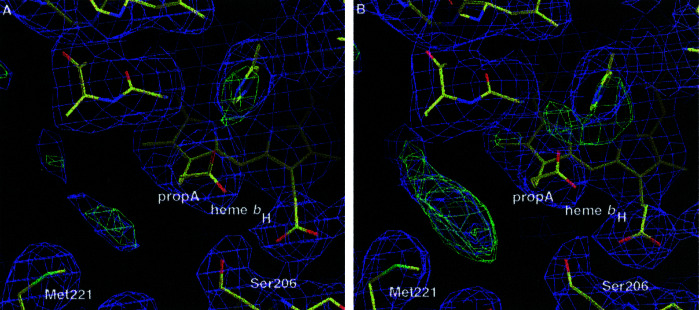
Small diffusible redox proteins facilitate electron transfer in respiration and photosynthesis by alternately binding to integral membrane proteins. Specific and transient complexes need to be formed between the redox partners to ensure fast turnover. In respiration, the mobile electron carrier cytochrome c shuttles electrons from the cytochrome bc1 complex to cytochrome c oxidase. Despite extensive studies of this fundamental step of energy metabolism, the structures of the respective electron transfer complexes were not known. Here we present the crystal structure of the complex between cytochrome c and the cytochrome bc1 complex from Saccharomyces cerevisiae. The complex was crystallized with the help of an antibody fragment, and its structure was determined at 2.97-A resolution. Cytochrome c is bound to subunit cytochrome c1 of the enzyme. The tight and specific interactions critical for electron transfer are mediated mainly by nonpolar forces. The close spatial arrangement of the c-type hemes unexpectedly suggests a direct and rapid heme-to-heme electron transfer at a calculated rate of up to 8.3 x 10(6) s(-1). Remarkably, cytochrome c binds to only one recognition site of the homodimeric multisubunit complex. Interestingly, the occupancy of quinone in the Qi site is higher in the monomer with bound cytochrome c, suggesting a coordinated binding and reduction of both electron-accepting substrates. Obviously, cytochrome c reduction by the cytochrome bc1 complex can be regulated in response to respiratory conditions.


Figures

Figure 1
Figure 1
(A) Half-of-the-sites binding of CYC to the homodimeric QCR. The overall structure of the complex between the redox partners CYC and QCR with bound Fv fragment is shown. Protein subunits are depicted in ribbon representation with respective colors: CYC (yellow), CYT1 (red), cytochrome b (blue), RIP1 (green), QCR6 (cyan), and Fv fragment (orange). All other subunits are colored in gray. Redox cofactors (ball-and-stick representation) are colored in black. The complex is viewed parallel to the plane of the inner membrane (IM) that separates the intermembrane space (IMS) from the matrix (MA). The position of the inner membrane is indicated as gray boxes. (B) Close-up view of the recognition site (indicated by a black frame in A) showing the experimental electron-density map before inclusion of CYC to the model. The 2FobsFcalc electron-density map (blue) is contoured at 1σ, and the corresponding part of the refined model (ball-and-stick presentation) is superimposed. The orientations of the CYC polypeptide (yellow) and its cofactor heme c (green) are unambiguously defined by distinct electron density. Protein residues of CYT1 and heme c1 are colored in red and magenta, respectively. The figure was generated by using the programs molscript (36) and bobscript (37).
Figure 2
Figure 2
The complementary recognition sites in the QCR/CYC complex. Surface representations of CYC and CYT1 are shown on Left and Right, respectively. (A) Residues that are involved in CYC binding and have intermolecular contacts of less than 4 Å are colored in green. (B) Residues, which are hydrophobic, are colored in orange. (C) Side chains, which have positive or negative full charges, are colored in blue or red, respectively. Color maxima correspond to +25 and −25 kBT. The figure was generated by using grasp (38).
Figure 3
Figure 3
Direct heme-to-heme electron transfer from CYT1 (Lower) of QCR to CYC (Upper). The short edge-to-edge distance (indicated as dashed line) between solvent exposed atoms of the pyrrole C rings of the cofactors allows rapid CYC reduction at a calculated rate of up to 8.3 × 10⁶ s−1. The polypeptides are represented as ribbon model with helices, β-strands, and loops colored in cyan, green, and yellow, respectively, and the heme groups are shown in ball-and-stick representation. The heme carbons are colored in gray, all other atoms according to standard coloring. The figure was generated by using the programs molscript (36) and bobscript (37).
Figure 4
Figure 4
Differences in the occupancy of the quinone reduction sites (Qi sites) of the homodimeric QCR. The Qi site of (A) monomer A and (B) monomer B, the latter has CYC bound, is shown with part of the quinone-ligating sphere including Ser-206, Met-221, and propionate A (propA) of heme bH. The electron-density map after final refinement is shown in blue (2FobsFcalc; contoured at 1σ) and in green (FobsFcalc; contoured at 3σ). Protein and cofactors are shown as stick drawings with atoms displayed in standard colors. The figure was prepared by using the program o (22).

References

    1. Saraste M. Science. 1999;283:1488–1493. - PubMed
    1. Mitchell P. J Theor Biol. 1976;62:327–367. - PubMed
    1. Brandt U, Trumpower B L. Crit Rev Biochem Mol Biol. 1994;29:165–197. - PubMed
    1. Yu C-A, Yu L, King T E. J Biol Chem. 1973;248:528–533. - PubMed
    1. Speck S H, Margoliash E. J Biol Chem. 1984;259:1064–1072. - PubMed

Publication types

Associated data