

Recombinant vaccinia virus-induced T-cell immunity: quantitation of the response to the virus vector and the foreign epitope
- PMID: 11884558
- PMCID: PMC136038
- DOI: 10.1128/jvi.76.7.3329-3337.2002
Recombinant vaccinia virus-induced T-cell immunity: quantitation of the response to the virus vector and the foreign epitope
Abstract
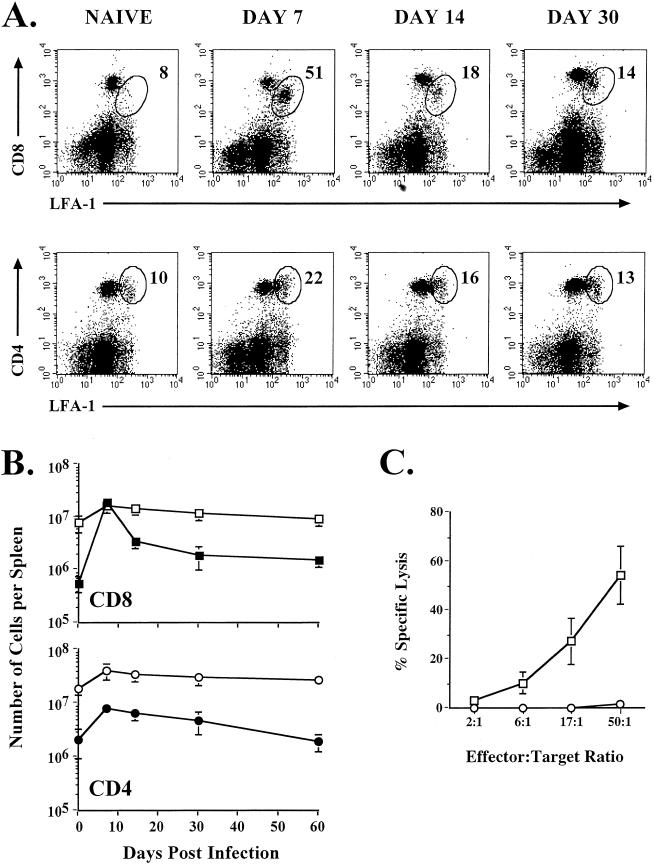
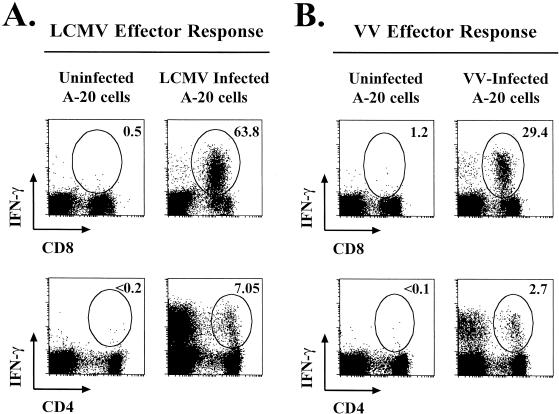
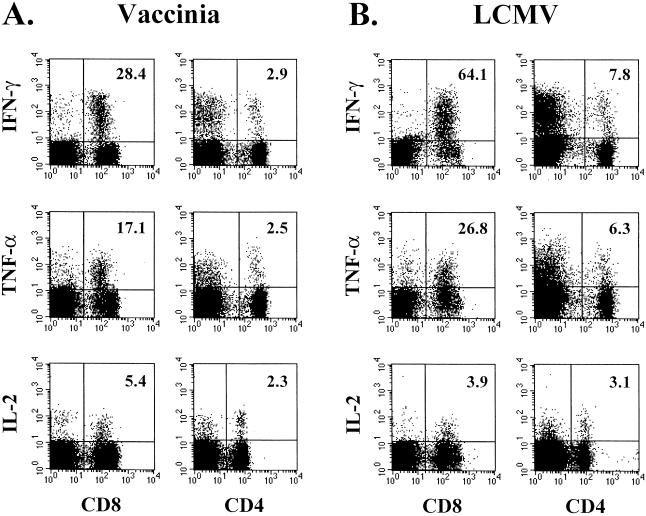
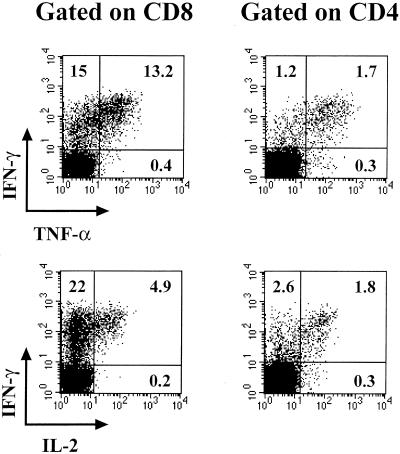
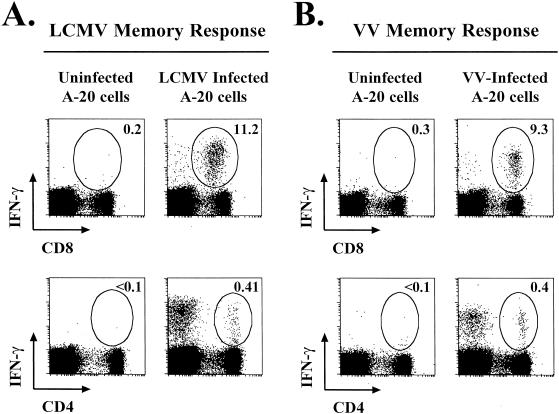
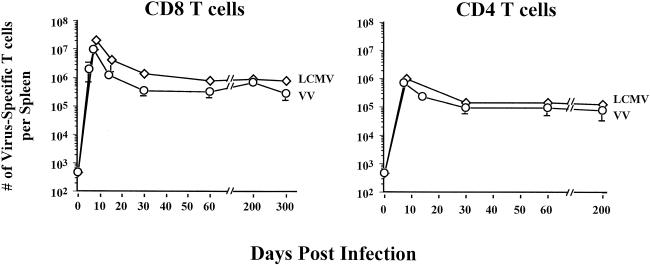
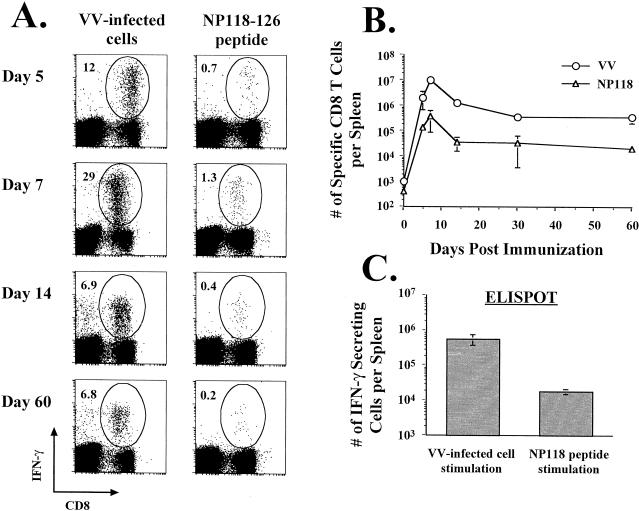
Recombinant vaccinia viruses (rVV) have been extensively used as vaccines, but there is little information about the total magnitude of the VV-specific T-cell response and how this compares to the immune response to the foreign gene(s) expressed by the rVV. To address this issue, we quantitated the T-cell responses to both the viral vector and the insert following the infection of mice with VV expressing a cytotoxic T lymphocyte (CTL) epitope (NP118-126) from lymphocytic choriomeningitis virus (LCMV). The LCMV epitope-specific response was quantitated by intracellular cytokine staining after stimulation with the specific peptide. To analyze the total VV-specific response, we developed a simple intracellular cytokine staining assay using VV-infected major histocompatibility complex class I and II matched cells as stimulators. Using this approach, we made the following determinations. (i) VV-NP118 induced potent and long-lasting CD8 and CD4 T-cell responses to the vector; at the peak of the response (approximately 1 week), there were approximately 10(7) VV-specific CD8 T cells (25% of the CD8 T cells) and approximately 10(6) VV-specific CD4 T cells (approximately 5% of the CD4 T cells) in the spleen. These numbers decreased to approximately 5 x 10(5) CD8 T cells (approximately 5% frequency) and approximately 10(5) CD4 T cells (approximately 0.5% frequency), respectively, by day 30 and were then stably maintained at these levels for >300 days. The size of this VV-specific T-cell response was comparable to that of the T-cell response induced following an acute LCMV infection. (ii) VV-specific CD8 and CD4 T cells were capable of producing gamma interferon (IFN-gamma), tumor necrosis factor alpha (TNF-alpha), and interleukin-2; all cells were able to make IFN-gamma, a subset produced both IFN-gamma and TNF-alpha, and another subset produced all three cytokines. (iii) The CD8 T-cell response to the foreign gene (LCMV NP118-126 epitope) was coordinately regulated with the response to the vector during all three phases (expansion, contraction, and memory) of the T-cell response. The total number of CD8 T cells responding to NP118-126 were approximately 20- to 30-fold lower than the number responding to the VV vector (approximately 1% at the peak and 0.2% in memory). This study provides a better understanding of T-cell immunity induced by VV-based vaccines, and in addition, the technique described in the study can be readily extended to other viral vectors to determine the ratio of the T-cell response to the insert versus the vector. This information will be useful in optimizing prime-boost regimens for vaccination.
Figures

Similar articles
-
Direct ex vivo kinetic and phenotypic analyses of CD8(+) T-cell responses induced by DNA immunization.J Virol. 2000 Sep;74(18):8286-91. doi: 10.1128/jvi.74.18.8286-8291.2000. J Virol. 2000. PMID: 10954526 Free PMC article.
-
Antiviral cytotoxic T-cell memory by vaccination with recombinant Listeria monocytogenes.J Virol. 1996 May;70(5):2902-10. doi: 10.1128/JVI.70.5.2902-2910.1996. J Virol. 1996. PMID: 8627765 Free PMC article.
-
Reduction of otherwise remarkably stable virus-specific cytotoxic T lymphocyte memory by heterologous viral infections.J Exp Med. 1996 Jun 1;183(6):2489-99. doi: 10.1084/jem.183.6.2489. J Exp Med. 1996. PMID: 8676069 Free PMC article.
-
Nonreplicating recombinant vaccinia virus expressing CD40 ligand enhances APC capacity to stimulate specific CD4+ and CD8+ T cell responses.Hum Gene Ther. 2005 Mar;16(3):348-60. doi: 10.1089/hum.2005.16.348. Hum Gene Ther. 2005. PMID: 15812230
-
Induction and function of virus-specific CD4+ T cell responses.Virology. 2011 Mar 15;411(2):216-28. doi: 10.1016/j.virol.2010.12.015. Epub 2011 Jan 14. Virology. 2011. PMID: 21236461 Free PMC article. Review.
Cited by
-
The Future of Smallpox Vaccination: is MVA the key?Med Immunol. 2005 Mar 1;4(1):2. doi: 10.1186/1476-9433-4-2. Med Immunol. 2005. PMID: 15740619 Free PMC article.
-
Heterologous prime/boost immunization with p53-based vaccines combined with toll-like receptor stimulation enhances tumor regression.J Immunother. 2010 Jul-Aug;33(6):609-17. doi: 10.1097/CJI.0b013e3181e032c6. J Immunother. 2010. PMID: 20551836 Free PMC article.
-
Interleukin 15 is required for proliferative renewal of virus-specific memory CD8 T cells.J Exp Med. 2002 Jun 17;195(12):1541-8. doi: 10.1084/jem.20020369. J Exp Med. 2002. PMID: 12070282 Free PMC article.
-
Dose-dependent lymphocyte apoptosis following respiratory infection with Vaccinia virus.Virus Res. 2008 Nov;137(2):198-205. doi: 10.1016/j.virusres.2008.07.010. Epub 2008 Aug 23. Virus Res. 2008. PMID: 18692098 Free PMC article.
-
CD127+CCR5+CD38+++ CD4+ Th1 effector cells are an early component of the primary immune response to vaccinia virus and precede development of interleukin-2+ memory CD4+ T cells.J Virol. 2006 Oct;80(20):10151-61. doi: 10.1128/JVI.02670-05. J Virol. 2006. PMID: 17005692 Free PMC article.
References
-
- Altenburger, W., C. P. Suter, and J. Altenburger. 1989. Partial deletion of the human host range gene in the attenuated vaccinia virus MVA. Arch. Virol. 105:15-27. - PubMed
-
- Carroll, M. W., and B. Moss. 1997. Poxviruses as expression vectors. Curr. Opin. Biotechnol. 8:573-577. - PubMed
-
- Chen, H. D., A. E. Fraire, I. Joris, M. A. Brehm, R. M. Welsh, and L. K. Selin. 2001. Memory CD8+ T cells in heterologous antiviral immunity and immunopathology in the lung. Nat. Immunol. 2:1067-1076. - PubMed
-
- Hanke, T., T. J. Blanchard, J. Schneider, C. M. Hannan, M. Becker, S. C. Gilbert, A. V. Hill, G. L. Smith, and A. McMichael. 1998. Enhancement of MHC class I-restricted peptide-specific T cell induction by a DNA prime/MVA boost vaccination regime. Vaccine 16:439-445. - PubMed
Publication types
MeSH terms
Substances
Grants and funding
LinkOut - more resources
Full Text Sources
Other Literature Sources
Research Materials
