. 2002 Mar 15;30(6):1371-8.
doi: 10.1093/nar/30.6.1371.

The solution structure of an oligonucleotide duplex containing a 2'-deoxyadenosine-3-(2-hydroxyethyl)- 2'-deoxyuridine base pair determined by NMR and molecular dynamics studies

Affiliations

The solution structure of an oligonucleotide duplex containing a 2'-deoxyadenosine-3-(2-hydroxyethyl)- 2'-deoxyuridine base pair determined by NMR and molecular dynamics studies

Yves Boulard et al. Nucleic Acids Res. .

Abstract

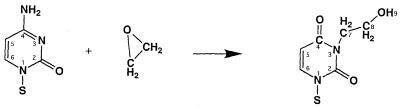
Determination of the solution structure of the duplex d(GCAAGTC(HE)AAAACG)*d(CGTTTTAGACTTGC) containing a 3-(2-hydroxyethyl)-2'-deoxyuridine*deoxyadenine (HE*A) base pair is reported. The three-dimensional solution structure, determined starting from 512 models via restrained molecular mechanics using inter-proton distances and torsion angles, converged to two final families of structures. For both families the HE and the opposite A residues are intrahelical and in the anti conformation. The hydroxyethyl chain lies close to the helix axis and for one family the hydroxyl group is above the HE*A plane and in the other case it is below. These two models were used to start molecular dynamic calculations with explicit solvent to explore the hydrogen bonding possibilities of the HE*A base pair. The dynamics calculations converge finally to one model structure in which two hydrogen bonds are formed. The first is formed all the time and is between HEO4 and the amino group of A, and the second, an intermittent one, is between the hydroxyl group and the N1 of A. When this second hydrogen bond is not formed a weak interaction CH...N is possible between HEC7H2 and N1A21. All the best structures show an increase in the C1'-C1' distance relative to a Watson-Crick base pair.


Figures

Figure 1
Figure 1
Formation of the 3-(2-hydroxyethyl)-2′-deoxyuridine base.
Figure 2
Figure 2
Expanded contour plot of the H6/H8–H1′/H5 region of the NOESY spectrum (110 ms mixing time) in 2H2O, 20°C. Cross-peaks marked with an X correspond to H6–H5 interactions. Peaks labeled A–F correspond to the H8/H6(n)–H5(n + 1) nuclear Overhauser effects (NOEs). The chemical shifts of the H2 resonances are shown on the upper horizontal axis.
Figure 3
Figure 3
The different patterns of hydrogen bonds for the HE·A base pair. (A and B) One hydrogen bond after minimization. (C–E) Two possible hydrogen bonds during the molecular dynamics calculations.
Figure 4
Figure 4
Expanded contour plot of the NOESY spectrum (250 ms mixing time) in H2O, 5°C and pH 6.0. The lower part shows the interactions between the imino protons. The upper part shows the interactions between the imino protons and the amino-CH3 region. The two protons of the amino groups of the cytosines and adenines are connected by a continuous line. Cross-peaks marked with an X correspond to the interaction between a thymine imino proton and the H2 of the adenine of the base pair. Cross-peaks labeled A–F correspond to the G imino–H5, on the opposite strand, interaction. Peaks H and G correspond to the T imino proton with its own CH3 group for T20 and T6, respectively. The cross-peaks in boxes are with the HE side chain.
Figure 5
Figure 5
(A) HE·A base pair superimposed on that of a T·A base pair, with a C1′–C1′ distance of 10.7 Å. (B) HE·A base pair with the C1′–C1′ distance increased to 12.2 Å. (C) Empty circles, variation of the global fit calculated from the 226 NMR distances as a function of the structure number; filled circles, variation of the fit calculated with the NMR distances involving only the five central base pairs of the duplex.
Figure 6
Figure 6
Two stereoscopic views corresponding to the best structures which were used to initiate the molecular dynamic simulations: (A) with the HE side chain above the plane of the base pair and (B) below it.
Figure 7
Figure 7
The different patterns of hydrogen bonds for the HE·A base pair. (A and B) One hydrogen bond after minimization. (C–E) Two possible hydrogen bonds during the molecular dynamics calculations.
Figure 8
Figure 8
(A) Evolution over time of the C1′–C1′ distance during the molecular dynamics simulations for the HE·A base pair (dots) and for an A·T base pair (bold). (B) Evolution over time during molecular dynamics simulations of the A21N1–HE8H9 distance. The corresponding populations are plotted in (C). (D) Time evolution during molecular dynamics simulations of the A21NH2–HE8O4 distance. Both protons of the amino group are plotted. (E) Time evolution during molecular dynamics simulations of the A21N1–HE8C7H2 distance. Both H71 and H72 are plotted.

Similar articles

Cited by

References

    1. Dellarco V.L., Generoso,W.M., Sega,G.A., Fowle,J.R.D. and Jacobson-Kram,D. (1990) Review of the mutagenicity of ethylene oxide. Environ. Mol. Mutagen., 16, 85–103. - PubMed
    1. Ehrenberg L. and Hussain,S. (1981) Genetic toxicity of some important epoxides. Mutat. Res., 86, 1–113. - PubMed
    1. Hogstedt C., Aringer,L. and Gustavsson,A. (1986) Epidemiologic support for ethylene oxide as a cancer-causing agent. J. Am. Med. Assoc., 255, 1575–1578. - PubMed
    1. Stayner L., Steenland,K., Greife,A., Hornung,R., Hayes,R.B., Nowlin,S., Morawetz,J., Ringenburg,V., Elliot,L. and Halperin,W. (1993) Exposure-response analysis of cancer mortality in a cohort of workers exposed to ethylene oxide. Am. J. Epidemiol., 138, 787–798. - PubMed
    1. International Agency for Research on Cancer (IARC) (1985) IARC Monographs on the Evaluation of Carcinogenic Risk of Chemicals to Humans. Allyls Compounds, Aldehydes, Epoxides and Peroxides. Vol. 36. IARC, Lyon, France, pp. 189–226.