Comparative Study
. 2002 Feb;14(2):373-86.
doi: 10.1105/tpc.010388.

Cryptochrome light signals control development to suppress auxin sensitivity in the moss Physcomitrella patens

Affiliations
Comparative Study

Cryptochrome light signals control development to suppress auxin sensitivity in the moss Physcomitrella patens

Takato Imaizumi et al. Plant Cell. 2002 Feb.

Abstract

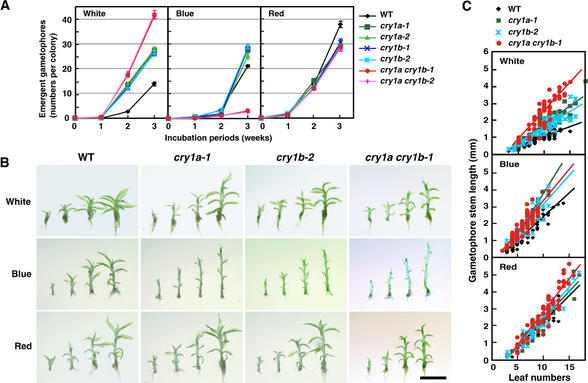
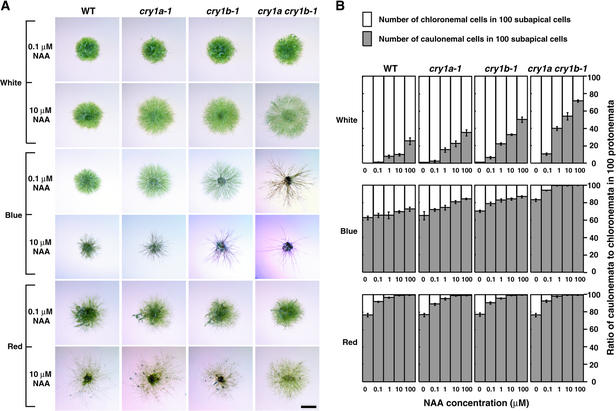
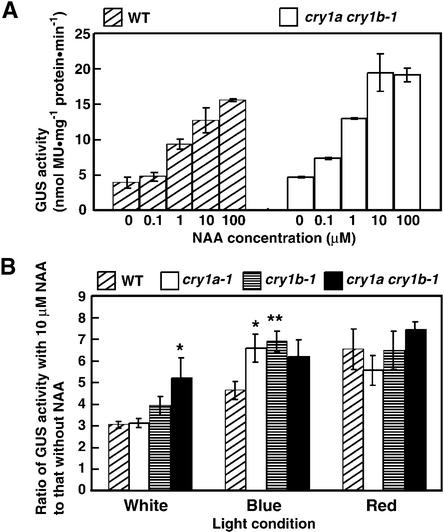
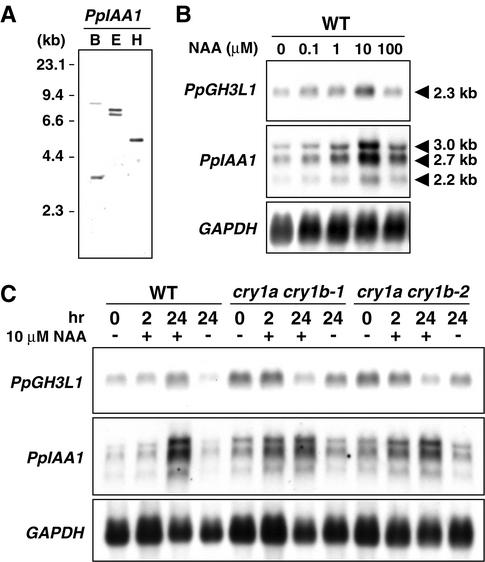
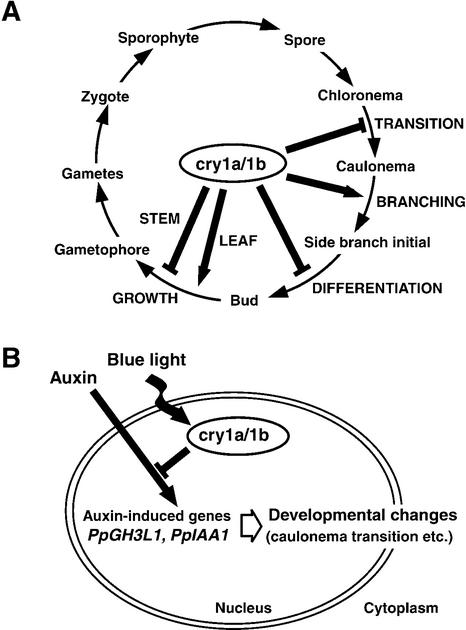
The blue light receptors termed cryptochromes mediate photomorphological responses in seed plants. However, the mechanisms by which cryptochrome signals regulate plant development remain obscure. In this study, cryptochrome functions were analyzed using the moss Physcomitrella patens. This moss has recently become known as the only plant species in which gene replacement occurs at a high frequency by homologous recombination. Two cryptochrome genes were identified in Physcomitrella, and single and double disruptants of these genes were generated. Using these disruptants, it was revealed that cryptochrome signals regulate many steps in moss development, including induction of side branching on protonema and gametophore induction and development. In addition, the disruption of cryptochromes altered auxin responses, including the expression of auxin-inducible genes. Cryptochrome disruptants were more sensitive to external auxin than wild type in a blue light-specific manner, suggesting that cryptochrome light signals repress auxin signals to control plant development.


Figures

Figure 1.
Figure 1.
Gene Structures of Moss Cryptochromes. (A) Scheme of the PpCRY1a and PpCRY1b cDNAs. The striped and black regions show the nucleotide sequences that are different between the PpCRY1a and PpCRY1b cDNAs. The percentages of identical nucleotides in the regions are shown. In the PpCRY1b transcript, the 5′ untranslated region of the PpCRY1b cDNA might be truncated, based on its size (see Figure 3C). ORF, open reading frame. (B) Scheme of the PpCRY1a and PpCRY1b genes. The boxes indicate exons, and each box pattern is the same as in (A). The positions of the probes used in (C) are indicated. The dark gray regions indicate sequences that are identical between PpCRY1a and PpCRY1b. The nucleotide sequence alignments at the beginning and the end of the identical regions are shown. The recognition sites of BglII (B) and EcoRI (E) are indicated. (C) DNA gel blot analysis of the PpCRY1a and PpCRY1b genes. Genomic DNA was digested by BglII (B), HindIII (H), or EcoRI (E). Blots were hybridized with the probe (1aN) specific to both cryptochrome genes under either low- or high-stringency conditions. The data for each specific probe (1a3′ and 1b3′) were obtained under high-stringency conditions.
Figure 2.
Figure 2.
Intracellular Distribution of GUS-PpCRY Fusion Proteins in Moss Protoplasts. (A) Alignment of amino acid sequences of the C termini of PpCRY1a, AcCRY3, and AcCRY4. The conserved amino acid residues are highlighted. The putative nuclear localization signal is underlined. (B) Protoplasts incubated under white light. The top row shows GUS activity, and the bottom row shows the positions of the nuclei in the same cells via 4′,6-diamidino-2-phenylindole (DAPI) fluorescence. Bar = 20 μm for all panels.
Figure 3.
Figure 3.
Cryptochrome Targeting Constructs and Confirmation of Disruption. (A) Scheme of the disruption of the PpCRY1a and PpCRY1b loci. The locations of primers used in (B) are shown by arrowheads. The probe that is supposed to hybridize both PpCRY1a and PpCRY1b (1aN) and that is used in (B) is indicated by white boxes, and the probes specific to each cryptochrome transcript used in (C) are indicated by closed boxes. The recognition sites of BglII (B) are indicated as well. Tnos, nopaline synthase terminator; Hygr, hygromycin-resistant; nptII, neomycin phosphotransferase II; hpt, hygromycin B phosphotransferase. (B) PCR genotyping analysis and genomic DNA gel blot analysis of cryptochrome disruptants. Genomic DNA was digested with BglII. The bands corresponding to either native PpCRY1a or PpCRY1b loci are indicated at left. The lengths of major bands are shown at right. WT, wild type. (C) RNA gel blot analysis of CRY transcripts in the cryptochrome disruptants. Poly(A)+ RNA derived from white light–grown protonemata were analyzed. As an internal control, the 1.1-kb fragment of Physcomitrella glyceraldehyde 3-phosphate dehydrogenase (GAPDH) cDNA was used (Leech et al., 1993).
Figure 4.
Figure 4.
Protonemal Colonies of Cryptochrome Disruptants under Different Light Conditions and Complementation of Cryptochrome Disruptants by Overexpression of PpCRY1b cDNA. Colonies of wild type, cry1a, cry1b, cry1a cry1b, and PpCRY1b cDNA overexpressors in the cry1a cry1b-1 background were inoculated on agar plates. These plates were incubated under continuous white, blue, or red light for 10 days. (A), (E), (I), and (M) Wild type (WT). (B), (F), (J), (N), and (O) cry1a-1. (C), (G), and (K) cry1b-1. (D), (H), (L), and (P) cry1a cry1b-1. (Q) to (T) PpCRY1b cDNA overexpressor in cry1a cry1b-1 (CRY1b+-1/ cry1a cry1b-1). (U) Different PpCRY1b cDNA overexpressor in cry1a cry1b-1 (CRY1b+-2/cry1a cry1b-1). The light conditions are as given: white light ([A] to [D] and [Q]); blue light ([E] to [H] and [R]); and red light ([I] to [J] and [S]). The blue light–grown protonemata are shown in (M) to (P) and (T) and (U). The protonema cell walls were stained with 0.1% (v/v) Calcofluor white to help distinguish each cell. The appearance of protonemata of cry1b strains was not distinguished from that of cry1a strain protonemata. Bars in (L) and (S) = 2 mm for (A) to (L) and (Q) to (S); bars in (M) to (P) and (T) and (U) = 200 μm. (V) Overexpression of PpCRY1b transcripts (arrowhead) in CRY1b+-1/ cry1a cry1b-1 strains was confirmed by RNA gel blot analysis. The asterisk shows the putative transcript derived from the disrupted PpCRY1b locus.
Figure 5.
Figure 5.
Gametophore Induction and Development Are Regulated by Cryptochromes. (A) Number of gametophores that emerged on the colonies of the cryptochrome disruptants. The colonies were incubated under white, blue, or red light for up to 3 weeks. Gametophores that emerged were counted every week. Each point represents the mean ±se derived from the data of 30 independent colonies. (B) Representative images of gametophores of one of each cryptochrome disruptant. Gametophores were collected from 3-week-old colonies after inoculation. The gametophores, which have 5, 7, 9, and 11 recognizable leaves, are placed from left to right in each image. Each image shows the gametophores of wild type, cry1a-1, cry1b-2, or cry1a cry1b-1 incubated under white, blue, or red light. The strains that are not shown here had the same phenotypes as each representative image of the cryptochrome disruptants. Bar = 2 mm for all panels. (C) Relationship between leaf number and stem length. Tissue was considered as a leaf if it clearly looked separate from the stem or if the conical premature leaf bundle appeared at the gametophore apex. The stem length is the length from the position of the shoot apical meristem (presented in the apical leaf bundle) to the end of the stem, not including rhizoids. Slopes calculated by fitting a linear regression line for each group of data are shown in the graph.
Figure 6.
Figure 6.
Cryptochrome Light Signals Inhibit Auxin Responses. Protonemal inocula were cultured for 10 days under different light conditions in the presence of 0.1 to 100 μM NAA in the medium. (A) Representative colony images of cryptochrome disruptants grown on medium containing different concentrations of NAA. Data obtained from the addition of 0.1 and 10 μM NAA are shown. The colonies incubated under the same light conditions without NAA are shown in Figure 4. Bar = 2 mm for all panels. (B) The ratio of caulonemal cells to chloronemal cells in 100 protonemal subapical cells incubated under different light conditions in the presence of NAA. Subapical cells of the protonemata were classified into chloronemal cells and caulonemal cells. The mean ±se of the number of caulonemal cells obtained from eight independent colonies, and 100 protonemal cells in each colony, were classified. WT, wild type.
Figure 7.
Figure 7.
Measurements of Auxin Signals in Cryptochrome Disruptants. (A) Soybean GH3 promoter activity in moss. The GH3::GUS vector was transformed into moss protoplasts and incubated under white light for 24 hr in the presence of different doses of NAA. The data show the mean ±se derived from one trial, which consisted of two sets of group data at each point. Similar data were obtained in different trials. MU, 4-methylumbelliferone. (B) Induction rates when exogenous NAA was added to the cryptochrome disruptants. The data show the induction values (mean ±se), which were calculated by dividing the means obtained from the data without NAA into the means obtained from the data in the presence of 10 μM NAA. These data were obtained from three different trials, each trial of which constituted of three different sets of group data (total, nine groups of data). * P < 0.05, ** P < 0.01 (Student's t test). WT, wild type.
Figure 8.
Figure 8.
Expression Levels of Native Auxin-Inducible Genes in Cryptochrome Disruptants. (A) DNA gel blot analysis of the PpIAA1 gene. B, BglII; E, EcoRI; H, HindIII. (B) Dose response of the accumulation of auxin-inducible genes in Physcomitrella. Five-day-old protonemata were treated with different concentrations of NAA for 24 hr. (C) Accumulation patterns of auxin-inducible genes in cryptochrome disruptants. Five-day-old protonemata of wild-type and cry1a cry1b strains were treated with 10 μM NAA (+) or mock solution (−) for 2 and 24 hr. WT, wild type.
Figure 9.
Figure 9.
Summary of Cryptochrome Functions in the Moss Life Cycle and Possible Model of Cryptochrome Signal Transductions via Auxin. (A) Cryptochrome functions revealed in this study are shown in this diagram of the moss life cycle. (B) The model shows one predicted interaction between cryptochrome light signals and auxin signals.

Similar articles

Cited by

References

    1. Abel, S., Nguyen, M.D., and Theologis, A. (1995). The PS-IAA4/5-like family of early auxin-inducible mRNAs in Arabidopsis thaliana. J. Mol. Biol. 251, 533–549. - PubMed
    1. Ahmad, M., and Cashmore, A.R. (1993). HY4 gene of A. thaliana encodes a protein with characteristics of a blue-light photoreceptor. Nature 366, 162–166. - PubMed
    1. Ahmad, M., Lin, C., and Cashmore, A.R. (1995). Mutations throughout an Arabidopsis blue-light photoreceptor impair blue-light-responsive anthocyanin accumulation and inhibition of hypocotyl elongation. Plant J. 8, 653–658. - PubMed
    1. Bhatla, S.C., and Bopp, M. (1985). The hormone regulation of protonema development in mosses. III. Auxin-resistant mutants of the moss Funaria hygrometrica Hedw. J. Plant Physiol. 120, 233–243.
    1. Briggs, W.R., and Huala, E. (1999). Blue-light photoreceptors in higher plants. Annu. Rev. Cell Dev. Biol. 15, 33–62. - PubMed

Publication types

MeSH terms

Associated data

LinkOut - more resources