Comparative Study
. 2002 Feb;14(2):465-77.
doi: 10.1105/tpc.010371.

The putative plasma membrane Na(+)/H(+) antiporter SOS1 controls long-distance Na(+) transport in plants

Affiliations
Comparative Study

The putative plasma membrane Na(+)/H(+) antiporter SOS1 controls long-distance Na(+) transport in plants

Huazhong Shi et al. Plant Cell. 2002 Feb.

Abstract

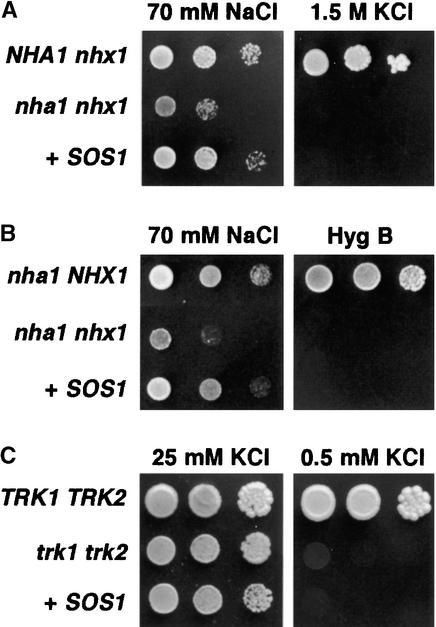
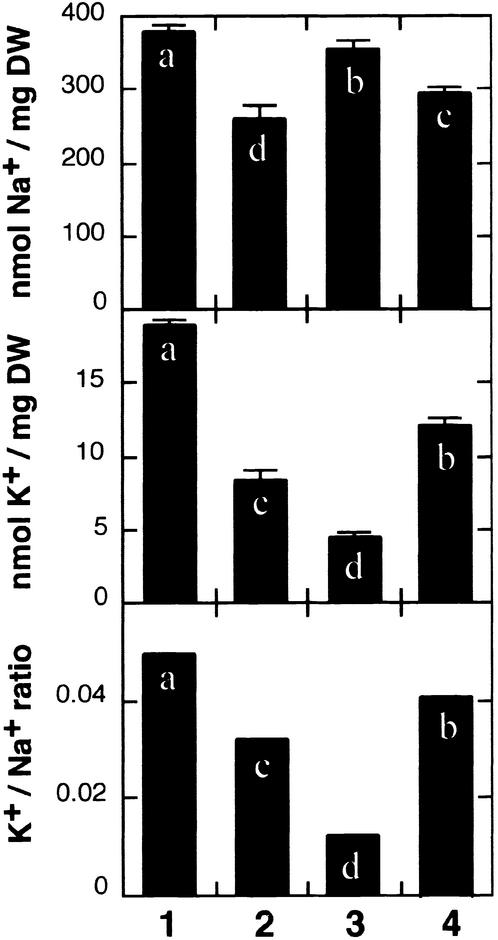
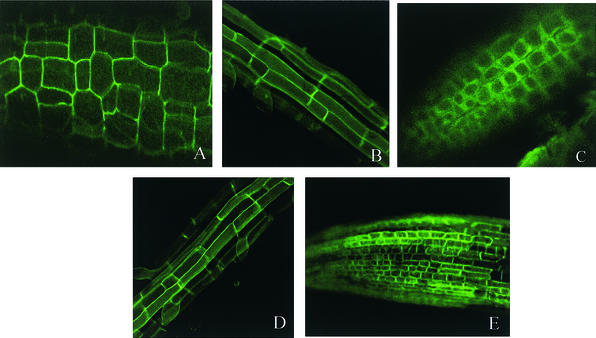
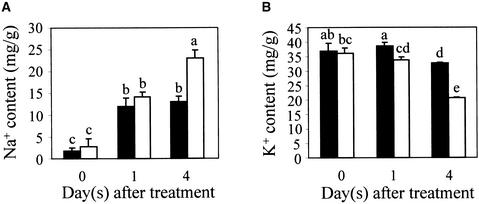
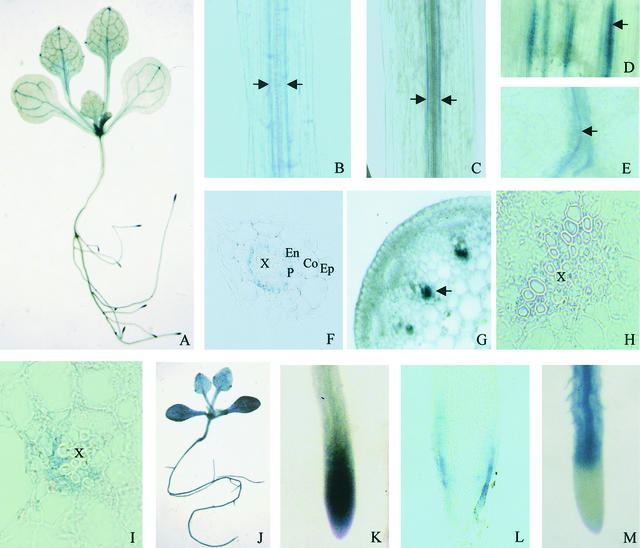
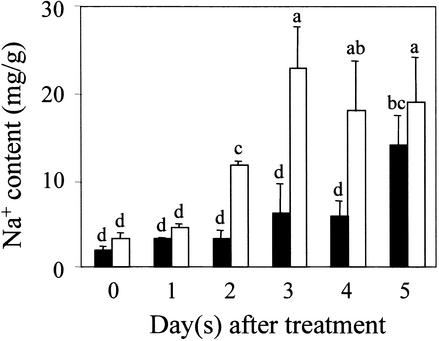
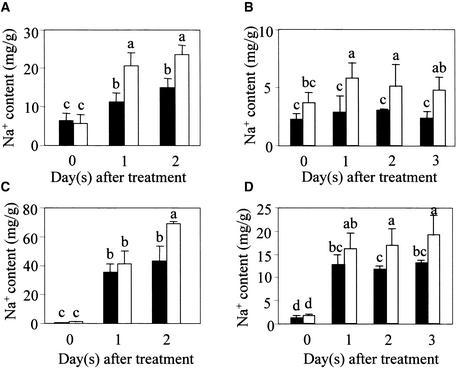
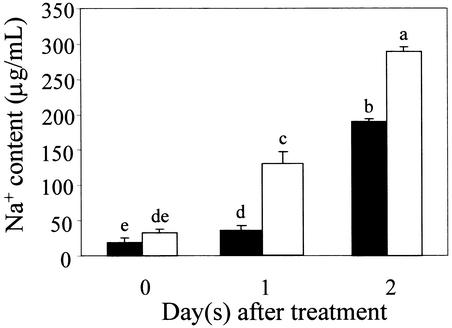
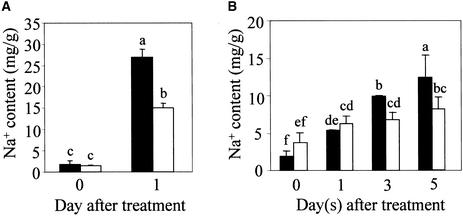
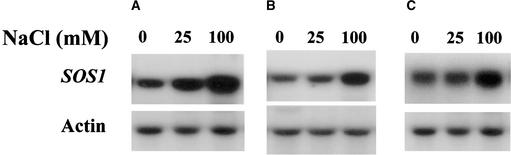
The salt tolerance locus SOS1 from Arabidopsis has been shown to encode a putative plasma membrane Na(+)/H(+) antiporter. In this study, we examined the tissue-specific pattern of gene expression as well as the Na(+) transport activity and subcellular localization of SOS1. When expressed in a yeast mutant deficient in endogenous Na(+) transporters, SOS1 was able to reduce Na(+) accumulation and improve salt tolerance of the mutant cells. Confocal imaging of a SOS1-green fluorescent protein fusion protein in transgenic Arabidopsis plants indicated that SOS1 is localized in the plasma membrane. Analysis of SOS1 promoter-beta-glucuronidase transgenic Arabidopsis plants revealed preferential expression of SOS1 in epidermal cells at the root tip and in parenchyma cells at the xylem/symplast boundary of roots, stems, and leaves. Under mild salt stress (25 mM NaCl), sos1 mutant shoot accumulated less Na(+) than did the wild-type shoot. However, under severe salt stress (100 mM NaCl), sos1 mutant plants accumulated more Na(+) than did the wild type. There also was greater Na(+) content in the xylem sap of sos1 mutant plants exposed to 100 mM NaCl. These results suggest that SOS1 is critical for controlling long-distance Na(+) transport from root to shoot. We present a model in which SOS1 functions in retrieving Na(+) from the xylem stream under severe salt stress, whereas under mild salt stress it may function in loading Na(+) into the xylem.


Figures

Figure 1.
Figure 1.
Complementation of Na+ and K+ Transport Mutants of Yeast by SOS1. S. cerevisiae strains AXT3 (nha1 nhx1) and WΔ3 (trk1 trk2) were transformed with plasmid containing SOS1 (+SOS1), whereas strains GX1 (NHA1 nhx1), ANT3 (nha1 NHX1), and W303 (TRK1 TRK2) were transformed with the empty vector. (A) and (B) Transformants were grown overnight in liquid arginine-phosphate medium (AP medium; 10 mM l-arginine, 8 mM PO4H3, 2 mM MgSO4, 0.2 mM CaCl2, 2% glucose + vitamins and trace elements, pH 6.5) with 1 mM KCl. Five microliters of serial decimal dilutions were spotted onto plates of the same medium supplemented with 70 mM NaCl and in YPD medium containing either 1.5 M KCl (A) or 50 μg/mL hygromycin B (Hyg B) (B). Plates were incubated at 28°C and photographed after 2 days (hygromycin B) or 4 days (NaCl and KCl). (C) Cells were grown in AP medium with 25 mM KCl, collected, and washed several times with distilled water until complete removal of KCl. Decimal dilutions were spotted onto AP plates containing either 25 mM KCl, to support the growth of trk1 trk2 mutants, or 0.5 mM KCl, a low concentration that prevents the growth of trk1 trk2 cells.
Figure 2.
Figure 2.
Expression of SOS1 in Yeast Na+/H+ Antiporter Mutants Reduces Na+ Accumulation. Cells of strains ANT3 (nha1 NHX1) (lane 1), GX1 (NHA1 nhx1) (lane 2), AXT3 (nha1 nhx1) (lane 3), and AXT3 transformed with plasmid containing SOS1 (lane 4) were grown in liquid AP medium supplemented with 1 mM KCl and 70 mM NaCl until midexponential growth phase and collected by filtration, and their Na+ and K+ contents were determined. Units are nanomoles of ion per milligram dry weight (DW) of cell samples. Data shown are averages and se values of ion contents of three independent cultures of each strain. Columns with different letters indicate significant difference at P < 0.05 (Fisher's protected LSD test).
Figure 3.
Figure 3.
Subcellular Localization of the SOS1-GFP Fusion Protein in Transgenic Arabidopsis Plants. (A) Localization of SOS1-GFP fluorescence in hypocotyl cells. (B) Localization of SOS1-GFP fluorescence in young root cells. (C) Localization of SOS1-GFP fluorescence in root tip cells plasmolyzed with 0.5 M mannitol. (D) Localization of PIP2a-GFP in young root cells. (E) Localization of PIP2a-GFP in root tip cells.
Figure 4.
Figure 4.
Callus Cultures from sos1 Mutant Plants Accumulate More Na+ and Less K+ Than Do Wild-Type Calli. (A) Na+ contents in wild-type and sos1 mutant calli. (B) K+ contents in wild-type and sos1 mutant calli. Closed bars, wild type; open bars, sos1-1 mutant. Data shown are averages and ±sd values of three independent experiments. Columns with different letters indicate significant difference at P < 0.05 (Fisher's protected LSD test).
Figure 5.
Figure 5.
SOS1 Promoter–GUS Expression Pattern in Transgenic Arabidopsis Plants, and Comparison with the Expression Pattern of AtNHX1 Promoter–GUS. Except for panels (J) and (M), all panels show SOS1::GUS expression. (J) and (M) show AtNHX1::GUS expression. (A) GUS staining in a SOS1::GUS seedling. Note the preferential GUS expression in the root tip and vasculature. (B) GUS expression in cells surrounding the vascular system in a young root in a SOS1::GUS plant. (C) GUS expression in cells surrounding the vascular system in the hypocotyl in a SOS1::GUS plant. (D) GUS expression in cells associated with vascular strands in an inflorescence stem in a SOS1::GUS plant. (E) GUS expression in cells surrounding leaf veins in a SOS1::GUS plant. (F) Cross-section of a root in a SOS1::GUS plant, showing GUS expression in the pericycle. (G) Hand section of an inflorescence stem in a SOS1::GUS plant, showing GUS expression associated with vascular strands. (H) Cross-section of an inflorescence stem, showing an enlarged image of a vascular strand. Note the GUS expression in xylem parenchyma cells. (I) Cross-section of a petiole in a SOS1::GUS plant, showing GUS expression in xylem parenchyma cells. (J) GUS expression in a AtNHX1::GUS seedling. Note the strong and virtually ubiquitous GUS expression. (K) GUS expression in a root tip in a SOS1::GUS plant. (L) Longitudinal section of the root tip shown in (K), showing GUS expression in epidermal cells. (M) GUS expression pattern in a root in a AtNHX1::GUS plant, showing that AtNHX1 is not expressed at the root tip. Co, cortex; En, endodermis; Ep, epidermis; P, pericycle; X, xylem vessel. Arrows indicate GUS expression associated with the vasculature in SOS1::GUS plants.
Figure 6.
Figure 6.
Soil-Grown sos1 Mutant Plants Accumulate More Na+ in the Shoot Than Do Wild-Type Plants in Response to 100 mM NaCl Treatment. Five independent experiments were performed, and similar patterns of ion accumulation were obtained. Results from one typical experiment are shown. Closed bars, wild type; open bars, sos1-1. Error bars represent ±sd (n = 3). Columns with different letters indicate significant difference at P < 0.05 (Fisher's protected LSD test).
Figure 7.
Figure 7.
Increased Na+ Accumulation in Both the Root and Shoot of sos1 Mutant Plants Grown in Hydroponic Culture or in Turface Soil. (A) Na+ contents in roots of hydroponically cultured plants. (B) Na+ contents in roots of plants grown in Turface soil. (C) Na+ contents in shoots of hydroponically cultured plants. (D) Na+ contents in shoots of plants grown in Turface soil. Closed bars, wild type; open bars, sos1-1. Error bars represent ±sd (n = 3). Columns with different letters indicate significant difference at P < 0.05 (Fisher's protected LSD test).
Figure 8.
Figure 8.
Soil-Grown sos1 Mutant Plants Accumulate More Na+ in the Xylem Sap in Response to 100 mM NaCl Treatment. Plants were grown in general soil mix in pots. After bolting, the plants were subjected to salt treatment by immersing the bottoms of the pots in a solution containing one-twentieth strength MS salts and 100 mM NaCl for the times indicated. Xylem sap was collected as described in Methods. Three independent experiments gave consistent results. Results from one typical experiment are shown. Closed bars, wild type; open bars, sos1-1. Error bars represent ±sd (n = 3). Columns with different letters indicate significant difference at P < 0.05 (Fisher's protected LSD test).
Figure 9.
Figure 9.
sos1 Mutant Plants Accumulate Less Na+ in Response to Mild NaCl Stress. (A) Na+ contents in wild-type and sos1 seedlings cultured in liquid medium. The medium consisted of half-strength MS salts and 2% sucrose, pH 5.6. Salt treatment was performed by adding NaCl to the medium to a final concentration of 25 mM. (B) Na+ content in aerial parts of wild-type and sos1 mutant plants grown in general soil mix. After 3 weeks of growth, the plants were treated by immersing the bottoms of the pots in a solution containing one-twentieth strength MS salts supplemented with 25 mM NaCl for the times indicated. The treated plants were kept in a chamber with near 100% RH. Two independent experiments were performed, and consistent results were obtained. Results from one typical experiment are shown. Closed bars, wild type; open bars, sos1-1. Error bars represent ±sd (n = 3). Columns with different letters indicate significant difference at P < 0.05 (Fisher's protected LSD test).
Figure 10.
Figure 10.
SOS1 Transcript Expression under Various Salt Treatment Regimens. (A) Shoot tissues from plants grown in regular soil with 2 days of salt treatment. (B) Whole seedlings grown in liquid culture with 1 day of salt treatment. (C) Shoot tissues from plants grown in regular soil under high humidity with 2 days of salt treatment. Actin probe was used as a control for RNA loading.

References

    1. Amtmann, A., and Sanders, D. (1999). Mechanisms of Na+ uptake by plant cells. Adv. Bot. Res. 29, 75–112.
    1. Apse, M.P., Aharon, G.S., Snedden, W.A., and Blumwald, E. (1999). Salt tolerance conferred by overexpression of a vacuolar Na+/H+ antiport in Arabidopsis. Science 285, 1256–1258. - PubMed
    1. Bañuelos, M.A., Sychrová, H., Bleykasten-Grosshans, C., Souciet, J.L., and Potier, S. (1998). The Nha1 antiporter of Saccharomyces cerevisiae mediates sodium and potassium efflux. Microbiology 144, 2749–2758. - PubMed
    1. Bechtold, N., Ellis, J., and Pelletier, G. (1993). In planta Agrobacterium mediated gene transfer by infiltration of adult Arabidopsis thaliana plants. C. R. Acad. Sci. Paris 316, 1194–1199.
    1. Blumwald, E., Aharon, G.S., and Apse, M.P. (2000). Sodium transport in plant cells. Biochim. Biophys. Acta 1465, 140–151. - PubMed

Publication types

MeSH terms