

Estimation in medical imaging without a gold standard
- PMID: 11887945
- PMCID: PMC3143018
- DOI: 10.1016/s1076-6332(03)80372-0
Estimation in medical imaging without a gold standard
Abstract
Rationale and objectives: In medical imaging, physicians often estimate a parameter of interest (eg, cardiac ejection fraction) for a patient to assist in establishing a diagnosis. Many different estimation methods may exist, but rarely can one be considered a gold standard. Therefore, evaluation and comparison of different estimation methods are difficult. The purpose of this study was to examine a method of evaluating different estimation methods without use of a gold standard.
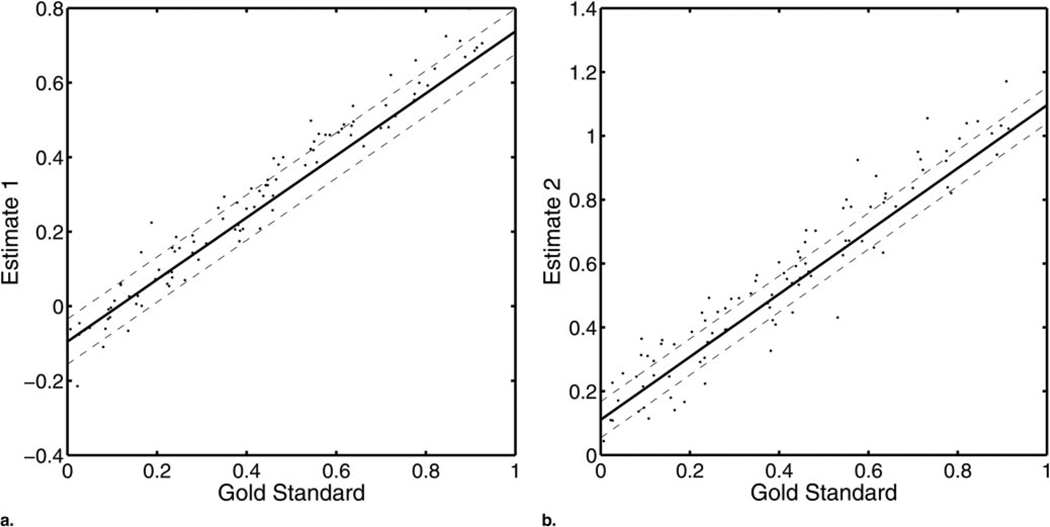
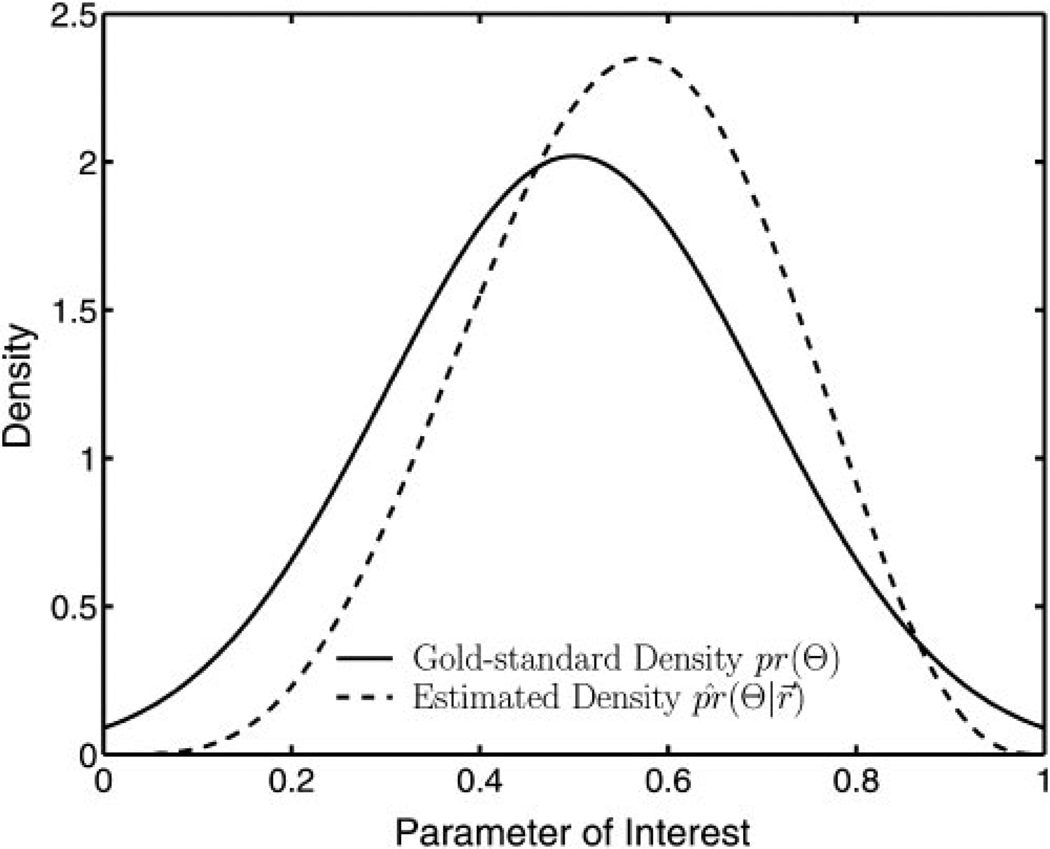
Materials and methods: This method is equivalent to fitting regression lines without the x axis. To use this method, multiple estimates of the clinical parameter of interest for each patient of a given population were needed. The authors assumed the statistical distribution for the true values of the clinical parameter of interest was a member of a given family of parameterized distributions. Furthermore, they assumed a statistical model relating the clinical parameter to the estimates of its value. Using these assumptions and observed data, they estimated the model parameters and the parameters characterizing the distribution of the clinical parameter.
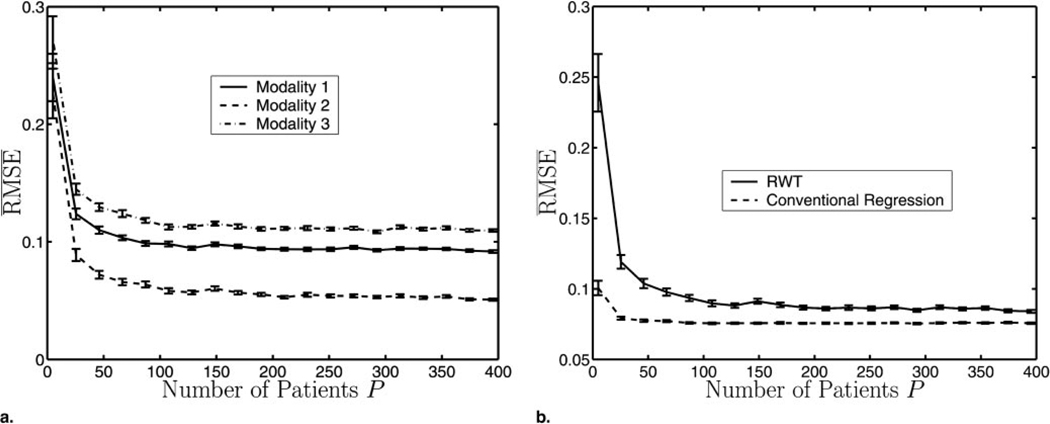
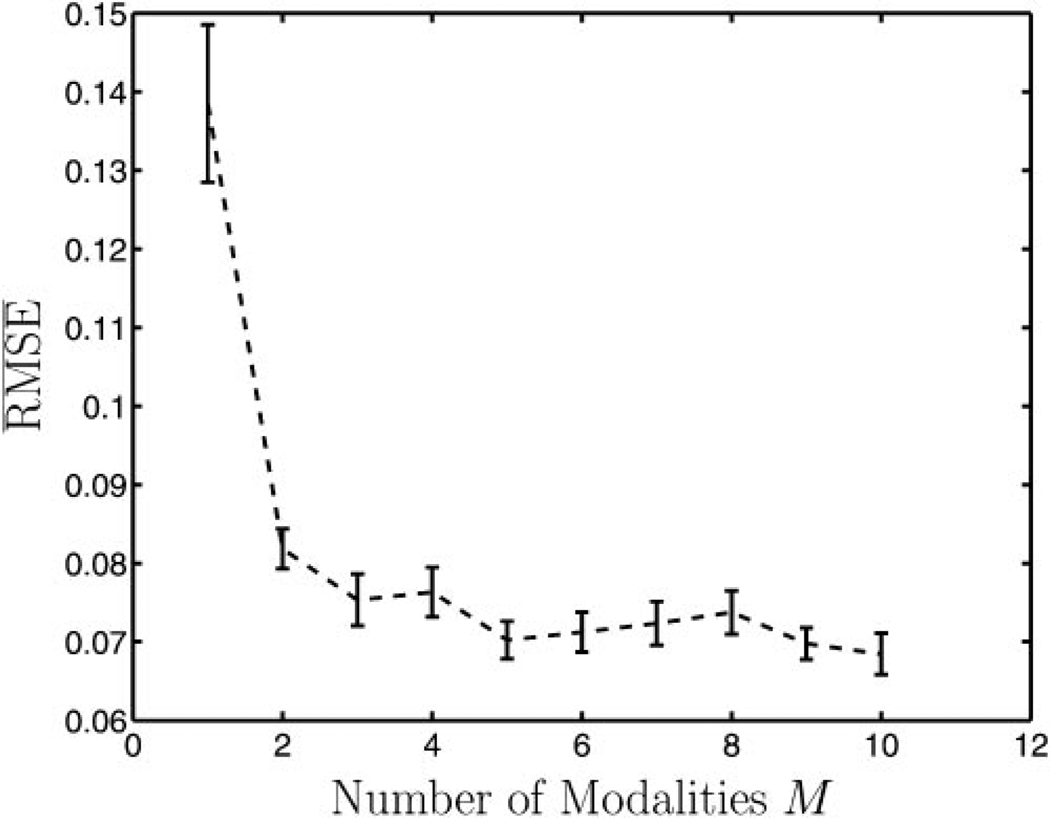
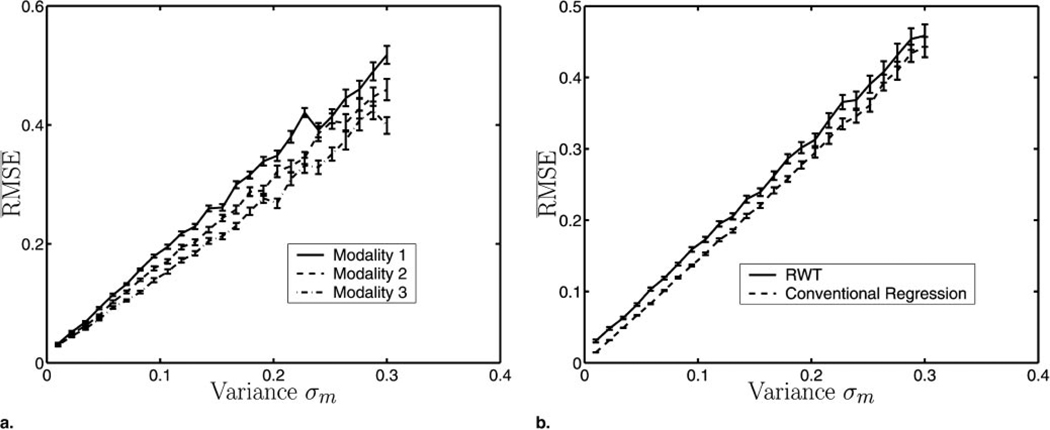
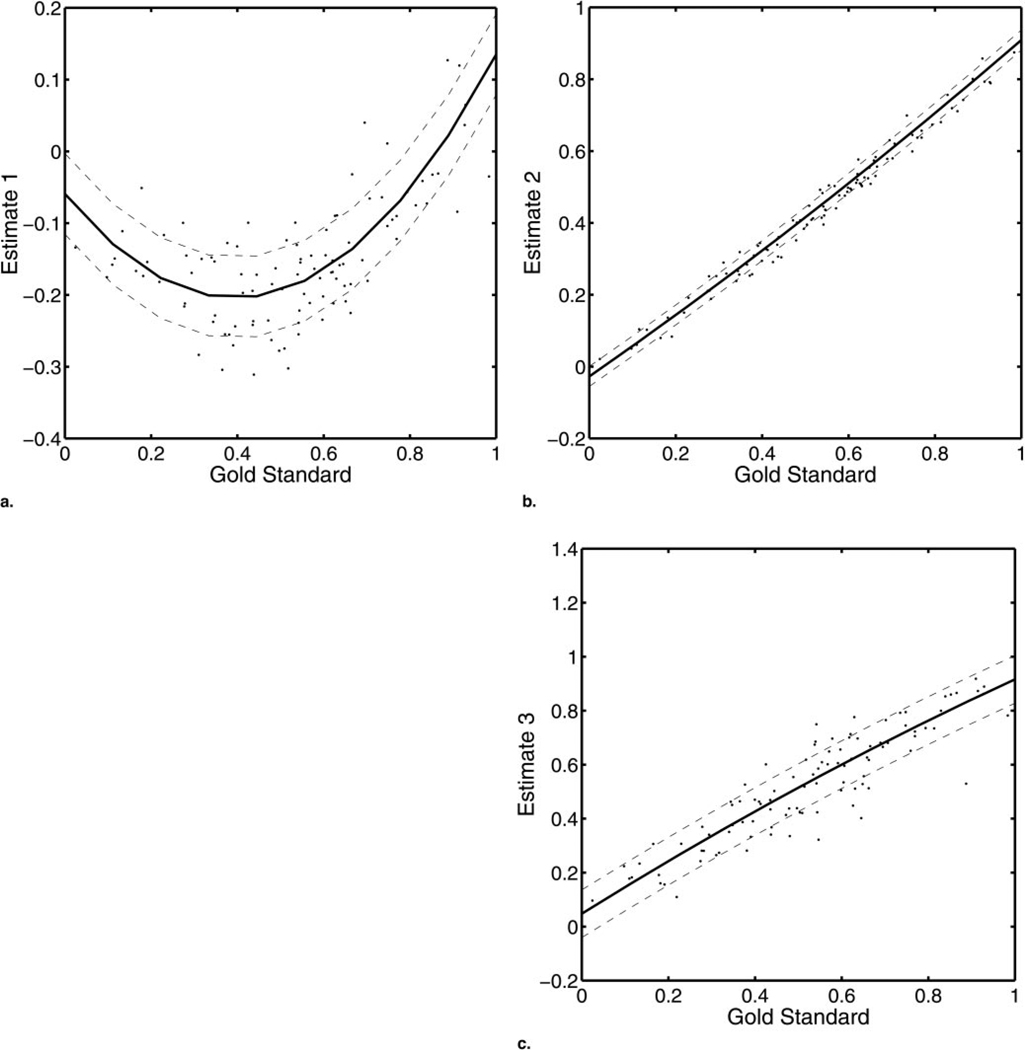
Results: The authors applied the method to simulated cardiac ejection fraction data with varying numbers of patients, numbers of modalities, and levels of noise. They also tested the method on both linear and nonlinear models and characterized the performance of this method compared to that of conventional regression analysis by using x-axis information. Results indicate that the method follows trends similar to that of conventional regression analysis as patients and noise vary, although conventional regression analysis outperforms the method presented because it uses the gold standard which the authors assume is unavailable.
Conclusion: The method accurately estimates model parameters. These estimates can be used to rank the systems for a given estimation task.
Figures
Similar articles
-
Objective comparison of quantitative imaging modalities without the use of a gold standard.IEEE Trans Med Imaging. 2002 May;21(5):441-9. doi: 10.1109/TMI.2002.1009380. IEEE Trans Med Imaging. 2002. PMID: 12071615 Free PMC article.
-
Evaluating Estimation Techniques in Medical Imaging Without a Gold Standard: Experimental Validation.Proc SPIE Int Soc Opt Eng. 2003 Feb 15;5034:10.1117/12.480330. doi: 10.1117/12.480330. Proc SPIE Int Soc Opt Eng. 2003. PMID: 26346933 Free PMC article.
-
Applications of Monte Carlo Simulation in Modelling of Biochemical Processes.In: Mode CJ, editor. Applications of Monte Carlo Methods in Biology, Medicine and Other Fields of Science [Internet]. Rijeka (HR): InTech; 2011 Feb 28. Chapter 4. In: Mode CJ, editor. Applications of Monte Carlo Methods in Biology, Medicine and Other Fields of Science [Internet]. Rijeka (HR): InTech; 2011 Feb 28. Chapter 4. PMID: 28045483 Free Books & Documents. Review.
-
Comparing cardiac ejection fraction estimation algorithms without a gold standard.Acad Radiol. 2006 Mar;13(3):329-37. doi: 10.1016/j.acra.2005.12.005. Acad Radiol. 2006. PMID: 16488845 Free PMC article.
-
Folic acid supplementation and malaria susceptibility and severity among people taking antifolate antimalarial drugs in endemic areas.Cochrane Database Syst Rev. 2022 Feb 1;2(2022):CD014217. doi: 10.1002/14651858.CD014217. Cochrane Database Syst Rev. 2022. PMID: 36321557 Free PMC article.
Cited by
-
Need for objective task-based evaluation of AI-based segmentation methods for quantitative PET.Proc SPIE Int Soc Opt Eng. 2023 Feb;12467:124670R. doi: 10.1117/12.2647894. Epub 2023 Apr 3. Proc SPIE Int Soc Opt Eng. 2023. PMID: 37990707 Free PMC article.
-
A robust and accurate center-frequency estimation (RACE) algorithm for improving motion estimation performance of SinMod on tagged cardiac MR images without known tagging parameters.Magn Reson Imaging. 2014 Nov;32(9):1139-55. doi: 10.1016/j.mri.2014.07.005. Epub 2014 Aug 1. Magn Reson Imaging. 2014. PMID: 25087857 Free PMC article.
-
Task-based evaluation of segmentation algorithms for diffusion-weighted MRI without using a gold standard.Phys Med Biol. 2012 Jul 7;57(13):4425-46. doi: 10.1088/0031-9155/57/13/4425. Epub 2012 Jun 20. Phys Med Biol. 2012. PMID: 22713231 Free PMC article.
-
Perfusion-weighted MR imaging studies in brain hypervascular diseases: comparison of arterial input function extractions for perfusion measurement.AJNR Am J Neuroradiol. 2006 May;27(5):1059-69. AJNR Am J Neuroradiol. 2006. PMID: 16687543 Free PMC article.
-
A no-gold-standard technique for objective assessment of quantitative nuclear-medicine imaging methods.Phys Med Biol. 2016 Apr 7;61(7):2780-800. doi: 10.1088/0031-9155/61/7/2780. Epub 2016 Mar 16. Phys Med Biol. 2016. PMID: 26982626 Free PMC article.
References
-
- Barrett HH. Objective assessment of image quality: effects of quantum noise and object variability. J Opt Soc Am A. 1990;7:1266–1278. - PubMed
-
- Feig SA. Estimation of currently attainable benefit from mammographic screening in women aged 40–49. Cancer. 1995;75:2412–2419. - PubMed
-
- Walter SD, Irwig LM. Estimation of test error rates, disease prevalence, and relative risk from misclassified data: a review. J Clin Epidemiol. 1988;41:923–937. - PubMed
-
- Metz CE. ROC methodology in radiologic imaging. Invest Radiol. 1986;21:720–733. - PubMed
-
- Henkelman RM, Kay I, Bronskill MJ. Receiver operator characteristic (ROC) analysis without truth. Med Decis Making. 1990;10:24–29. - PubMed
Publication types
MeSH terms
Grants and funding
LinkOut - more resources
Full Text Sources
Medical