. 2002 Mar 19;41(11):3620-7.
doi: 10.1021/bi0160011.

Function of extracellular loop 2 in rhodopsin: glutamic acid 181 modulates stability and absorption wavelength of metarhodopsin II

Affiliations

Function of extracellular loop 2 in rhodopsin: glutamic acid 181 modulates stability and absorption wavelength of metarhodopsin II

Elsa C Y Yan et al. Biochemistry. .

Abstract

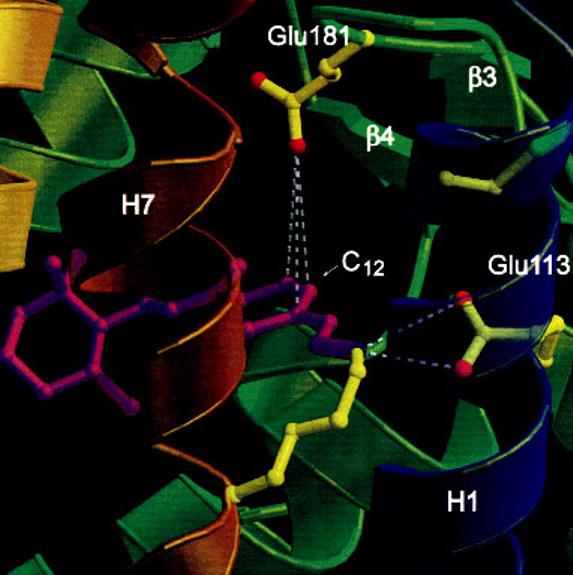
The second extracellular loop of rhodopsin folds back into the membrane-embedded domain of the receptor to form part of the binding pocket for the 11-cis-retinylidene chromophore. A carboxylic acid side chain from this loop, Glu181, points toward the center of the retinal polyene chain. We studied the role of Glu181 in bovine rhodopsin by characterizing a set of site-directed mutants. Sixteen of the 19 single-site mutants expressed and bound 11-cis-retinal to form pigments. The lambda(max) value of mutant pigment E181Q showed a significant spectral red shift to 508 nm only in the absence of NaCl. Other substitutions did not significantly affect the spectral features of the mutant pigments in the dark. Thus, Glu181 does not contribute significantly to spectral tuning of the ground state of rhodopsin. The most likely interpretation of these data is that Glu181 is protonated and uncharged in the dark state of rhodopsin. The Glu181 mutants displayed significantly increased reactivity toward hydroxylamine in the dark. The mutants formed metarhodopsin II-like photoproducts upon illumination but many of the photoproducts displayed shifted lambda(max) values. In addition, the metarhodopsin II-like photoproducts of the mutant pigments had significant alterations in their decay rates. The increased reactivity of the mutants to hydroxylamine supports the notion that the second extracellular loop prevents solvent access to the chromophore-binding pocket. In addition, Glu181 strongly affects the environment of the retinylidene Schiff base in the active metarhodopsin II photoproduct.


Figures

F<sc>IGURE</sc> 1
FIGURE 1
: Molecular graphics diagram of the RET chromophore-binding pocket of Rho. The RET chromophore-binding pocket is shown from within the plane of the membrane bilayer. TM helices are shown in ribbon format with helix 1 and helix 7 in the foreground. The β3 and β4 strands arise from E2. RET is colored magenta, and amino acid side chains are colored yellow except for nitrogen atoms (blue) and oxygen atoms (red). RET is situated such that its proximal end (approximately from C9 to C15) lies along the β4 strand and its distal end (approximately from C9 to the cyclohexenyl ring) lies along helix 3. One of the oxygen atoms of the side chain of Glu181 points toward C12 of RET. This figure was prepared using Molscript (35) and Raster3D () and represents the A chain of the crystal structure coordinates ().
F<sc>IGURE</sc> 2
FIGURE 2
: Visible absorbance spectroscopy of mutant pigment E181Q. A UV-visible absorbance spectrum was recorded for purified mutant pigment E181Q in the absence of NaCl at pH 6.5. The λmax values are indicated for each spectrum. The λmax values for the entire set of Glu181 mutants are listed in Table 1. Inset: (A) Visible spectrum of E181Q at pH 6.5 after the addition of NaCl to a final concentration of 200 mM. (B) Visible spectrum of E181Q in 200 mM NaCl at pH 4.5.
F<sc>IGURE</sc> 3
FIGURE 3
: Photobleaching difference spectra of expressed Rho and selected mutant pigments. For each pigment (Rho, E181Q, E181G, E181D, E181W, and E181Y), a dark spectrum and a spectrum after illumination were recorded. The calculated difference spectrum is presented where the change in absorbance (dark minus light) is plotted as a function of wavelength. Spectra are presented without alteration of data by averaging or smoothing algorithms. Values for λmax determined from absolute spectra are presented in Table 1.
F<sc>IGURE</sc> 4
FIGURE 4
: UV absorbance spectroscopy of expressed Rho and selected mutant pigments. For each pigment (Rho, E181Q, E181F, E181D, E181W, and E181Y), a spectrum was recorded after illumination. Absorbance was plotted as a function of wavelength in the range of the MII-like photoproduct peak. Values for λmaxdetermined from curve fits are indicated in the figure and are listed in Table 1 for the entire set of mutants.
F<sc>IGURE</sc> 5
FIGURE 5
: Measurements of MII decay rates and Gt activation rates of expressed Rho and mutant pigments E181Q, E181G, and E181W. (A) Decay of MII was monitored as the increase in tryptophan fluorescence intensity as a function of time. Purified Rho or a Glu181 replacement mutant (80 nM) was incubated at 20 °C for 10 min and then bleached for 15 s to photoconvert the pigment to MII. Fluorescence was recorded immediately following photolysis. Normalized data points are plotted and fit to single-exponential curves. A complete data set of calculated t1/2 vales is presented in Table 1. (B) The rate of Gt activation that was catalyzed by Rho or a Glu181 replacement mutant was monitored at 10 °C as the increase in intrinsic fluorescence intensity of Gt following uptake of GTPγS. Purified Rho or a Glu181 replacement mutant (2 nM) was added at 100-150 s to a cuvette containing bovine Gt (250 nM) under continuous illumination. The reaction was initiated at 200 s by the addition of GTPγS (5 mM). The fluorescence intensity immediately following GTPγS addition was normalized to zero. The rates of Gt activation were determined by linear regression through the first 30-60 s of data after the addition of GTPγS. A complete data set of Gt activation for the selected mutant pigment relative to that of Rho is presented in Table 1.

References

    1. Menon ST, Han M, Sakmar TP. Physiol. Rev. 2001;81:1659–1688. - PubMed
    1. Ballesteros JA, Shi L, Javitch JA. Mol. Pharmacol. 2001;60:1–19. - PubMed
    1. Stryer L. J. Biol. Chem. 1991;266:10711–10714. - PubMed
    1. Palczewski K, Kumasaka T, Hori T, Behnke CA, Motoshima H, Fox BA, Le Trong I, Teller DC, Okada T, Stenkamp RE, Yamamoto M, Miyano M. Science. 2000;289:739–745. - PubMed
    1. Kochendoerfer GG, Lin SW, Sakmar TP, Mathies RA. Trends Biochem. Sci. 1999;24:300–305. - PubMed

Publication types