. 2002 Mar 15;21(6):1339-49.
doi: 10.1093/emboj/21.6.1339.

Arabidopsis FHY3 defines a key phytochrome A signaling component directly interacting with its homologous partner FAR1

Affiliations

Arabidopsis FHY3 defines a key phytochrome A signaling component directly interacting with its homologous partner FAR1

Haiyang Wang et al. EMBO J. .

Abstract

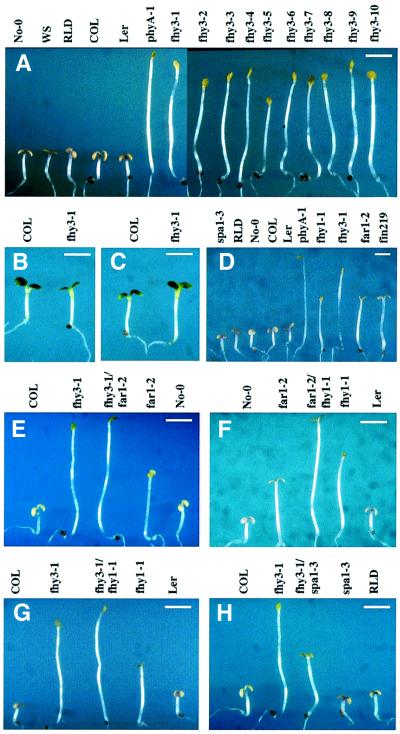
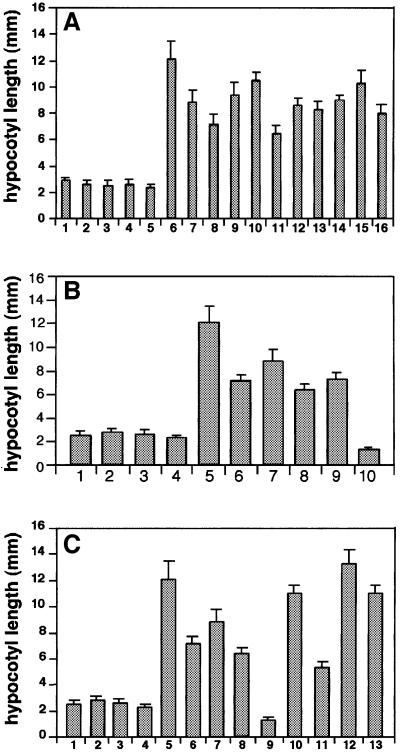
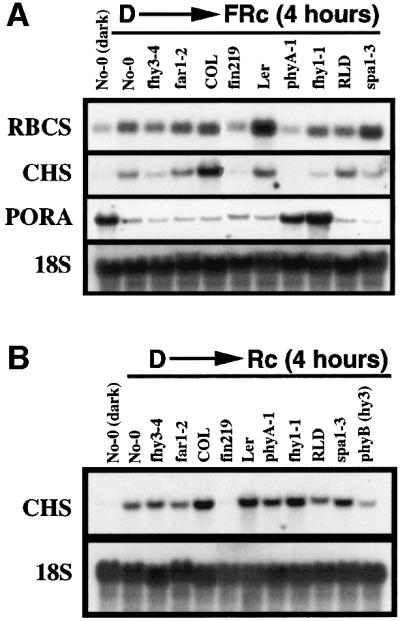
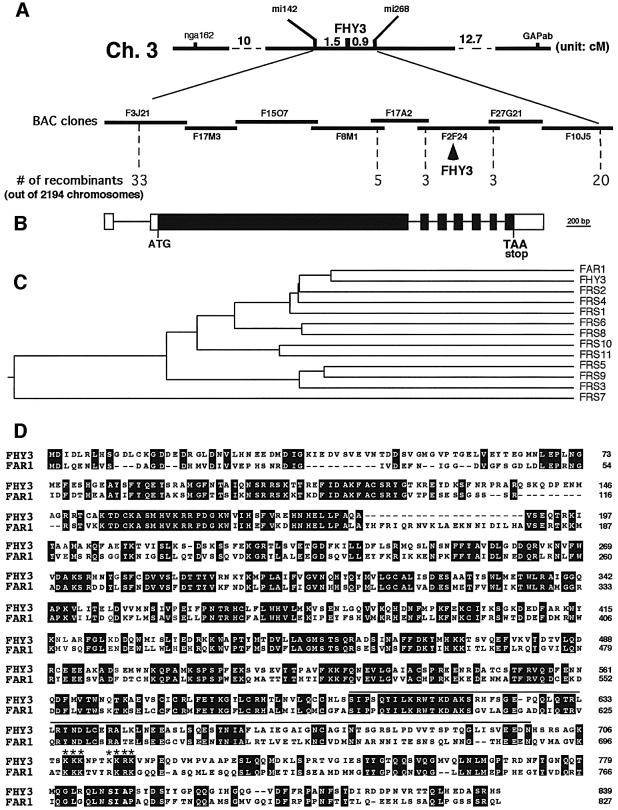
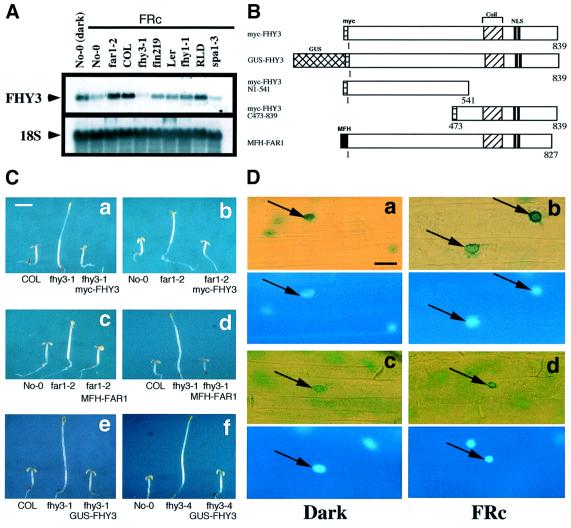
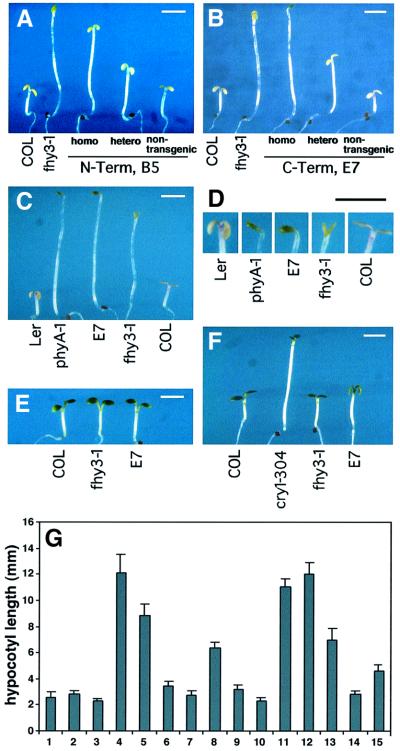
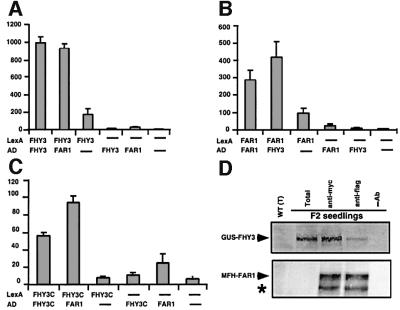
In Arabidopsis, phytochrome A (phyA) is the primary photoreceptor mediating various plant responses to far-red (FR) light. Here we show that phyA signaling involves a combinatorial action of downstream intermediates, which controls overlapping yet distinctive sets of FR responses. FHY3 is a prominent phyA signaling intermediate sharing structural similarity to FAR1, a previously identified phyA signaling component. The fhy3 and far1 mutants display similar yet distinctive defects in phyA signaling; however, overexpression of either FHY3 or FAR1 suppresses the mutant phenotype of both genes. Moreover, overexpression of partial fragments of FHY3 can cause a dominant-negative interference phenotype on phyA signaling that is stronger than those of the fhy3 or far1 null mutants. Further, we demonstrate that FHY3 and FAR1 are capable of homo- and hetero-interaction. Our data indicate that FHY3, together with FAR1, defines a key module in a signaling network underlying phyA-mediated FR light responses.


Figures

None
Fig. 1. Phenotype of fhy3 and double-mutant analysis of FR specific mutants. (Afhy3 mutants (10 alleles) are deficient in FRc-induced inhibition of hypocotyl elongation and cotyledon expansion. Also shown are seedlings of five ecotypes of WT Arabidopsis and the phyA-1 mutant. (Bfhy3-1 grown under R light (compared with its corresponding ecotype Col). (Cfhy3-1 grown under B light. (D) Far-red grown seedling phenotypes of five FRc specific mutants (spa1-3, fhy1-1, fhy3-1, far1-2 and fin219) compared with their corresponding ecotypes and the phyA-1 mutant. (EG) The fhy3-1/far1-2, far1-2/fhy1, fhy3-1/fhy1 double mutants display longer hypocotyls and less-unfolded cotyledons than their parental mutants. (H) The fhy3-1/spa1-3 double mutant has an intermediate length of hypocotyl. Scale bar in all panels: ∼2 mm.
None
Fig. 2. Quantitative analysis of the hypocotyl length of Arabidopsis phyA signaling mutants and double mutants. (A) Ten alleles of fhy3 mutants, phyA-1 and their corresponding ecotypes: (1) No-0, (2) WS, (3) RLD, (4) Col, (5) Ler, (6) phyA-1, (7) fhy3-1, (8) fhy3-2, (9) fhy3-3, (10) fhy3-4, (11) fhy3-5, (12) fhy3-6, (13) fhy3-7, (14) fhy3-8, (15) fhy3-9, (16) fhy3-10. The error bars represent the standard deviations. (B) phyA signaling mutants and their corresponding ecotypes: (1) RLD, (2) No-0, (3) Col, (4) Ler, (5) phyA-1, (6) fhy1-1, (7) fhy3-1, (8) far1-2, (9) fin219, (10) spa1-3. The error bars represent the standard deviations. (C) The phyA signaling mutants, double mutants and their respective ecotypes: (1) RLD, (2) No-0, (3) Col, (4) Ler, (5) phyA-1, (6) fhy1-1, (7) fhy3-1, (8) far1-2, (9) spa1-3, (10) fhy3-1/far1-2, (11) fhy3-1/spa1-3, (12) fhy3-1/fhy1-1, (13) far1-2/fhy1-1. The error bars represent the standard deviations.
None
Fig. 3. RNA gel blot analysis of light-regulated gene expression in phyA signaling mutants. fhy3-4 and far1-2 are in No-0 ecotype background. fin219 is in COL ecotype background. phyA-1, fhy1-1 and hy3 (phyB) are in Ler ecotype background. spa1-3 is in RLD ecotype background. For the dark control experiment, only No-0 ecotype is shown, as the expression of RBCS, CHS and PORA is of similar levels in these four different ecotype WT seedlings. (A) Effects of fhy3 and other FR signaling mutants on FR induction (4 h) of RBCS, CHS, and FR repression of PORA. An 18S rRNA was used as the loading control. (B) Effects of fhy3 and other FR specific signaling mutants on R induction (4 h) of CHS.
None
Fig. 4. Cloning and molecular characterization of the FHY3 gene. (A) Cloning of FHY3 by chromosomal walking. FHY3 was initially mapped to the top arm of chromosome 3 between the SSLP markers nga162 and GAPab, and further narrowed down to a region flanked by two RFLP markers, mi142 and mi268. A BAC clone contig was established and new RFLP markers were developed to continue the walk. The FHY3 gene was eventually located to a single BAC clone, F2F24. (B) Genomic structure of the FHY3 gene. The exons (white boxes denote the 5′- and 3′-untranslated regions; black boxes denote the protein coding sequence) are shown as boxes and introns as lines. The start and stop codons are indicated. (C) Phylogenetic tree of the FHY3 gene family, which is composed of 13 members. FHY3 shares highest homology with FAR1 (AF159587). These homologous genes are distributed on all five chromosomes of Arabidopsis. FRS1 (T04883), FRS5 (T05645) and FRS9 (T05644) are located on chromosome 4 (BAC F18F4 for FRS1 and BAC F20D10 for both FRS5 and FRS9). FRS2 (AC005700) and FRS3 (AC005623) are located on chromosome 2 (BACs T32F6 and T20P8, respectively). FRS4 (AC012394), FRS6 (AC008016), FRS8 (AC011717) and FRS11 (AC005489) are located on chromosome 1 (BAC F15M4 for FRS4, BAC F6D8 for FRS6, BAC F19K16 for FRS8, F14N23 for FRS11). FRS7 (AC018907) is located on chromosome 3 (BAC F28L1). FRS10 (AF262043) is located on chromosome V (BAC T26D3). The plot was obtained by the Jotun hein algorithm of the Megalign program (DNAstar, Madison, WI). (D) Sequence alignment of FHY3 and FAR1. Identical residues are shaded. The predicted coiled-coil region of FHY3 is highlighted by a single line at the top. The stars denote the residues for the putative NLS.
None
Fig. 5. FHY3 expression, overexpression and FHY3 protein localization. (A) RNA gel blot analysis of FHY3 expression in dark- and FRc-grown WT seedlings as well as in various FRc-grown mutant seedlings. (B) Diagram of the constructs used in plant transformation experiments. The predicted coiled-coil region and the NLS of FHY3, the myc and myc-flag-HA (MFH) epitopes and the GUS gene coding region are indicated. (C) Overexpression of myc-FHY3 and MFH-FAR1. The fhy3 and far1 mutant phenotypes are rescued by overexpressing the corresponding gene (a and c) and suppressed by overexpressing the homologous gene (b and d). GUS-FHY3 also rescues the fhy3 mutant phenotype (e and f). All panels were taken at the same magnification. Scale bar: ∼2 mm. (D) Subcellular localization of the FHY3 protein in the Arabidopsis hypocotyl cells. Each panel is composed of two portions. The upper portions are the GUS staining of GUS–FHY3 (a and b) and GUS–NIa (c and d). The lower portions are DAPI staining of the corresponding images to show the positions of the nuclei (indicated by arrows). The left panels are from dark-grown seedlings and the right panels from FRc-grown seedlings. All panels were taken at the same magnification. Scale bar: ∼50 µm.
None
Fig. 6. Dominant-negative effect caused by overexpressing partial fragments of FHY3. (A and B) The T2 generation of the transgenic lines B5 (a representative myc-FHY3N1–541 line) and E7 (a representative myc-FHY3C473–839 line) segregate homozygotes (homo), heterozygotes (hetero) and non-transgenic seedlings. The genotypes of the seedlings are determined by drug-resistance tests and the phenotypic segregation ratios of their T3 generation seedlings. (C) Comparison of the homozygote seedlings of E7 with phyA-1 and fhy3-1. Also shown are their respective WT ecotype seedlings. (D) Close-ups of the cotyledons for seedlings shown in (C). (E) E7 homozygote seedlings respond normally to R. (F) E7 homozygote seedlings have marginally elongated hypocotyls under B light. Scale bars: ∼2 mm. (G) Quantitative analysis of hypocotyl length of various transgenic lines compared with the mutants and wild-type controls: (1) Col, (2) No-0, (3) Ler, (4) phyA-1, (5) fhy3-1, (6) fhy3-1, myc-FHY3, (7) fhy3-1, MFH-FAR1, (8) far1-2, (9) far1-2, MFH-FAR1, (10) far1-2, myc-FHY3, (11) fhy3-1/far1-2, (12) E7, homozygotes, (13) E7, heterozygotes, (14) E7, segregated non-transgenic seedlings, (15) N-terminal, B5 homozygotes.
None
Fig. 7. Direct interaction between FHY3 and FAR1. (AC) Quantitative analyses of the relative β-galactosidase activities for the yeast two-hybrid assay. The LexA and AD fusion constructs used in the assay are shown at the bottom of each panel. Unless otherwise indicated, full-length proteins were used. The ‘—’ signs represent the empty vector controls. (A) FHY3 interacts with itself and with FAR1. (B) FAR1 interacts with itself and with FHY3. (C) An FHY3 C-terminal fragment (FHY3C, amino acids 541–839) interacts with FAR1. (D) Co-immunoprecipitaion of GUS–FHY3 and MFH–FAR1. Light-grown F2 seedlings harboring both GUS–FHY3 and MFH–FAR1 were subjected to an immunoprecipitation procedure with either myc or flag monoclonal antibodies. The myc antibody recognizes both MFH–FAR1 and GUS–FHY3, thus serving as a positive control, whereas the flag antibody only recognizes MFH–FAR1. The precipitates were subjected to western blot analyses probed with either a GUS antibody (Molecular Probes) for detecting the GUS–FHY3 fusion protein (upper panel) or a flag antibody (Sigma) for detecting the MFH–FAR1 fusion protein (lower panel). The asterisk indicates a possible degradation product of MFH–FAR1. T, total protein extracts; F2, F2 seedlings from a genetic cross between the GUS–FHY3 and MFH–FAR1 transgenic lines; –Ab, the sample was processed for immunoprecipitation without adding any antibody.

Similar articles

Cited by

References

    1. Ausubel F., Brent,R., Kingston,R.E., Moore,D.D., Seidman,J.G., Smith, J.A. and Struhl,K. (1999) Short Protocols in Molecular Biology. John Wiley and Sons, New York, NY.
    1. Ballesteros M., Bolle,C., Lois,L.M., Moore,J.M., Vielle-Calzada,J.-P., Grossniklaus,U. and Chua,N.-H. (2001) LAF1, a MYB transcription activator for phytochrome A signaling. Genes Dev., 15, 2613–2625. - PMC - PubMed
    1. Barnes S.A., Quaggio,R.B., Whitelam,G.C. and Chua,N.-H. (1996a) fhy1 defines a branch point in phytochrome A signal transduction pathways for gene expression. Plant J., 10, 1155–1161. - PubMed
    1. Barnes S.A., Nishizawa,N.K., Quaggio,R.B., Whitelam,G.C. and Chua,N.-H. (1996b) Far-red light blocks greening of Arabidopsis seedlings via a phytochrome A-mediated change in plastid development. Plant Cell, 8, 601–615. - PMC - PubMed
    1. Bell C.J. and Ecker,J.R. (1994) Assignment of 30 microsatellite loci to the linkage map of Arabidopsis. Genomics, 19, 137–144. - PubMed

Publication types

MeSH terms