

Differential DNA binding of transcriptional regulator PcaU from Acinetobacter sp. strain ADP1
- PMID: 11889107
- PMCID: PMC134916
- DOI: 10.1128/JB.184.7.1988-1997.2002
Differential DNA binding of transcriptional regulator PcaU from Acinetobacter sp. strain ADP1
Abstract
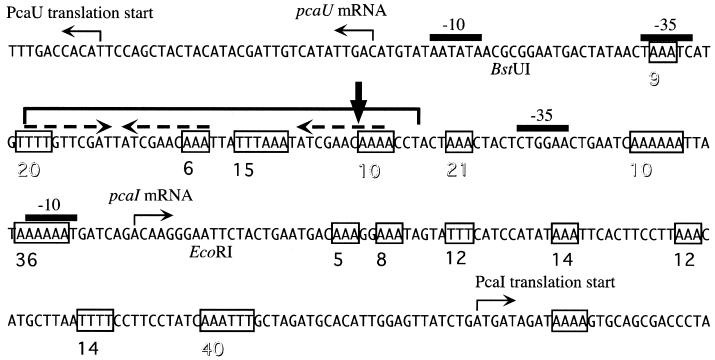
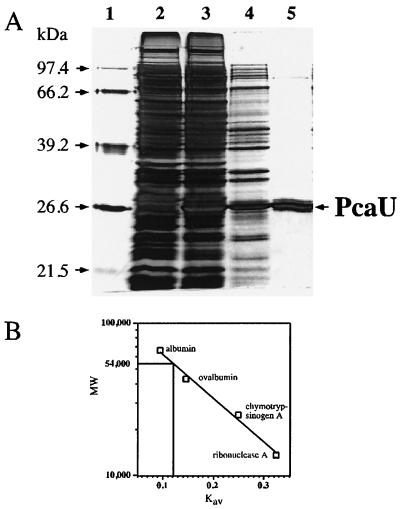
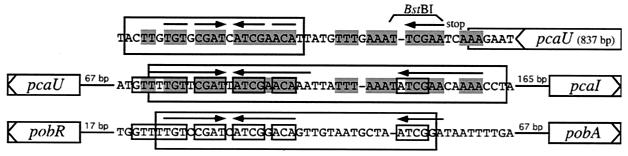
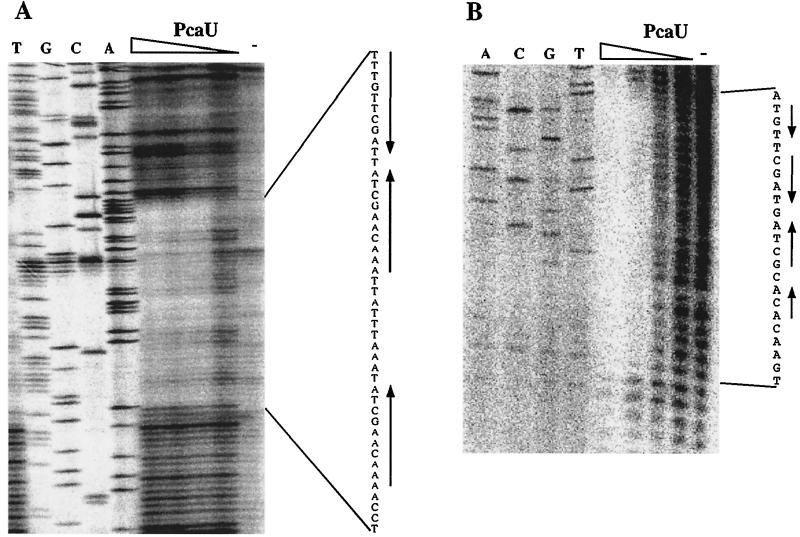
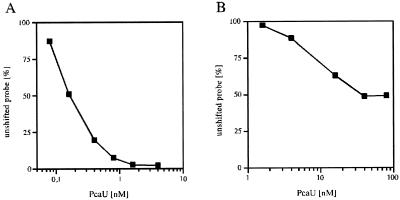
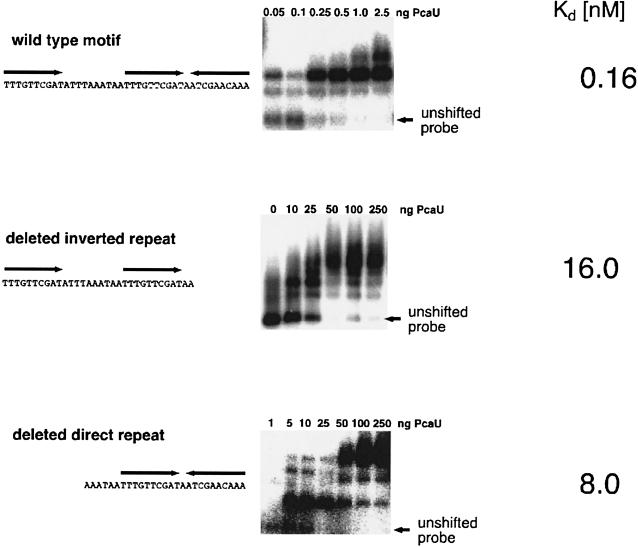
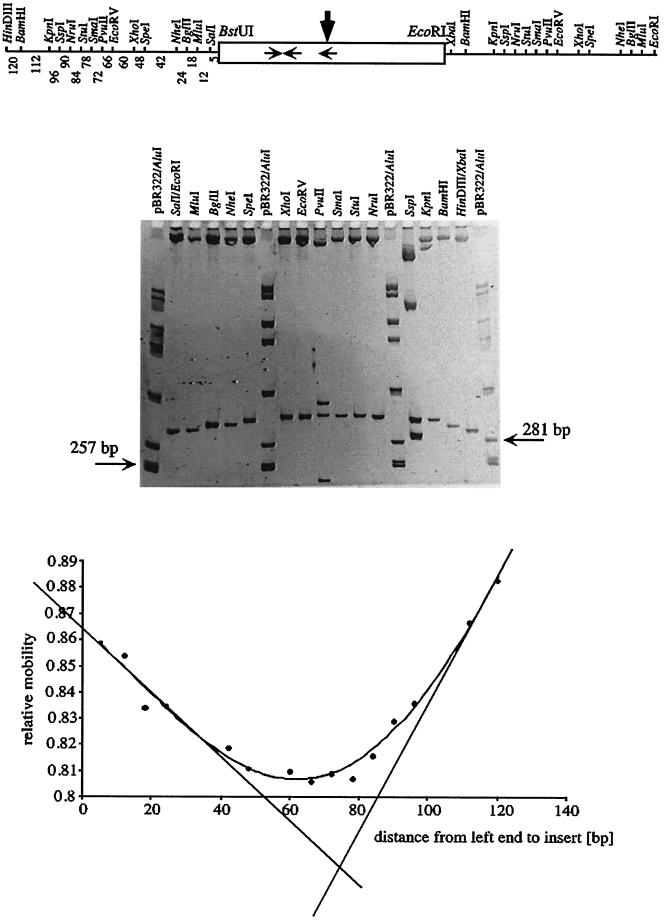
Transcriptional regulator PcaU from Acinetobacter sp. strain ADP1 governs expression of genes for protocatechuate degradation (pca genes) as a repressor or an activator depending on the levels of the inducer protocatechuate and of its own gene. PcaU is a member of the IclR protein family. Here the DNA binding properties of the purified protein are described in terms of the location of the binding sites and the affinity to these sites. Native PcaU was purified after overexpression of the pcaU gene in Escherichia coli. It is a dimer in solution. The binding site in the pcaU-pcaI intergenic region is located between the two divergent promoters covering 45 bp, which includes three perfect 10-bp repetitions. A PcaU binding site downstream of pcaU is covered by PcaU across two palindromic sequence repetitions. The affinity of PcaU for the intergenic binding sites is 50-fold higher (dissociation constant [K(d)], 0.16 nM) than the affinity for the site downstream of pcaU (K(d), 8 nM). The binding of PcaU was tested after modifications of the intergenic binding site. Removal of any external sequence repetition still allowed for specific binding of PcaU, but the affinity was significantly reduced, suggesting an important role for all three sequence repetitions in gene expression. The involvement of DNA bending in the regulatory process is suggested by the observed strong intrinsic curvature displayed by the pcaU-pcaI intergenic DNA.
Figures
Similar articles
-
PcaU, a transcriptional activator of genes for protocatechuate utilization in Acinetobacter.J Bacteriol. 1998 Mar;180(6):1512-24. doi: 10.1128/JB.180.6.1512-1524.1998. J Bacteriol. 1998. PMID: 9515921 Free PMC article.
-
Relevance of nucleotides of the PcaU binding site from Acinetobacter baylyi.Microbiology (Reading). 2008 Mar;154(Pt 3):756-766. doi: 10.1099/mic.0.2007/013508-0. Microbiology (Reading). 2008. PMID: 18310022
-
Effects exerted by transcriptional regulator PcaU from Acinetobacter sp. strain ADP1.J Bacteriol. 2001 Feb;183(3):873-81. doi: 10.1128/JB.183.3.873-881.2001. J Bacteriol. 2001. PMID: 11208784 Free PMC article.
-
Mutation analysis of PobR and PcaU, closely related transcriptional activators in acinetobacter.J Bacteriol. 1998 Oct;180(19):5058-69. doi: 10.1128/JB.180.19.5058-5069.1998. J Bacteriol. 1998. PMID: 9748437 Free PMC article.
-
Members of the IclR family of bacterial transcriptional regulators function as activators and/or repressors.FEMS Microbiol Rev. 2006 Mar;30(2):157-86. doi: 10.1111/j.1574-6976.2005.00008.x. FEMS Microbiol Rev. 2006. PMID: 16472303 Review.
Cited by
-
Deletion mutations caused by DNA strand slippage in Acinetobacter baylyi.Appl Environ Microbiol. 2006 Aug;72(8):5239-45. doi: 10.1128/AEM.00283-06. Appl Environ Microbiol. 2006. PMID: 16885271 Free PMC article.
-
Transcriptional organization of genes for protocatechuate and quinate degradation from Acinetobacter sp. strain ADP1.Appl Environ Microbiol. 2005 Feb;71(2):1025-34. doi: 10.1128/AEM.71.2.1025-1034.2005. Appl Environ Microbiol. 2005. PMID: 15691962 Free PMC article.
-
GenR, an IclR-type regulator, activates and represses the transcription of gen genes involved in 3-hydroxybenzoate and gentisate catabolism in Corynebacterium glutamicum.J Bacteriol. 2013 Apr;195(7):1598-609. doi: 10.1128/JB.02216-12. Epub 2013 Jan 25. J Bacteriol. 2013. PMID: 23354754 Free PMC article.
-
Multiple-level regulation of genes for protocatechuate degradation in Acinetobacter baylyi includes cross-regulation.Appl Environ Microbiol. 2007 Jan;73(1):232-42. doi: 10.1128/AEM.01608-06. Epub 2006 Nov 3. Appl Environ Microbiol. 2007. PMID: 17085716 Free PMC article.
-
Comparative Analysis of the IclR-Family of Bacterial Transcription Factors and Their DNA-Binding Motifs: Structure, Positioning, Co-Evolution, Regulon Content.Front Microbiol. 2021 Jun 10;12:675815. doi: 10.3389/fmicb.2021.675815. eCollection 2021. Front Microbiol. 2021. PMID: 34177859 Free PMC article.
References
-
- Ansari, A. Z., J. E. Bradner, and T. V. O'Halloran. 1995. DNA-bend modulation in a repressor-to-activator switching mechanism. Nature 374:371-375. - PubMed
-
- Bradford, M. M. 1976. A rapid and sensitive method for the quantitation of microgram quantities of protein utilizing the principle of protein-dye binding. Anal. Biochem. 72:248-254. - PubMed
-
- Carey, J. 1991. Gel retardation. Methods Enzymol. 208:103-117. - PubMed
Publication types
MeSH terms
Substances
LinkOut - more resources
Full Text Sources
