

Selective cyclooxygenase-2 blocker delays healing of esophageal ulcers in rats and inhibits ulceration-triggered c-Met/hepatocyte growth factor receptor induction and extracellular signal-regulated kinase 2 activation
- PMID: 11891194
- PMCID: PMC1867196
- DOI: 10.1016/S0002-9440(10)64918-8
Selective cyclooxygenase-2 blocker delays healing of esophageal ulcers in rats and inhibits ulceration-triggered c-Met/hepatocyte growth factor receptor induction and extracellular signal-regulated kinase 2 activation
Abstract
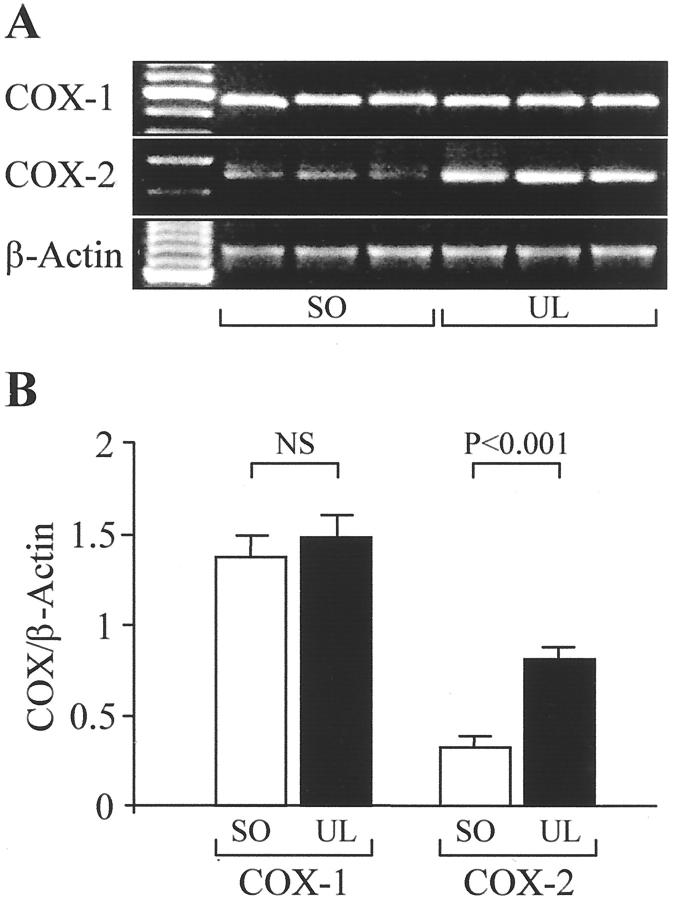
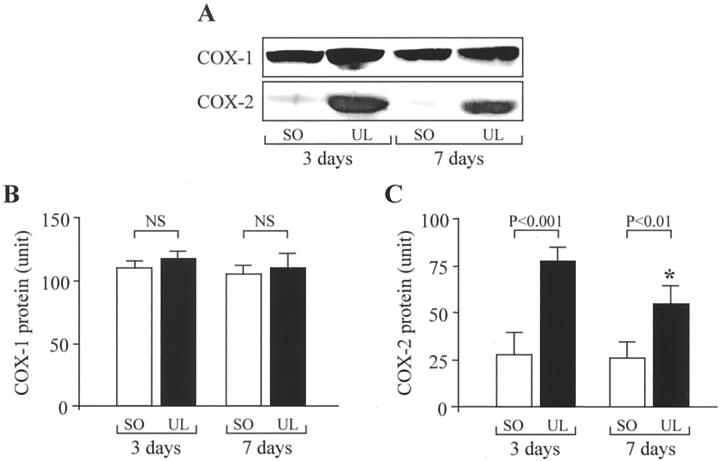
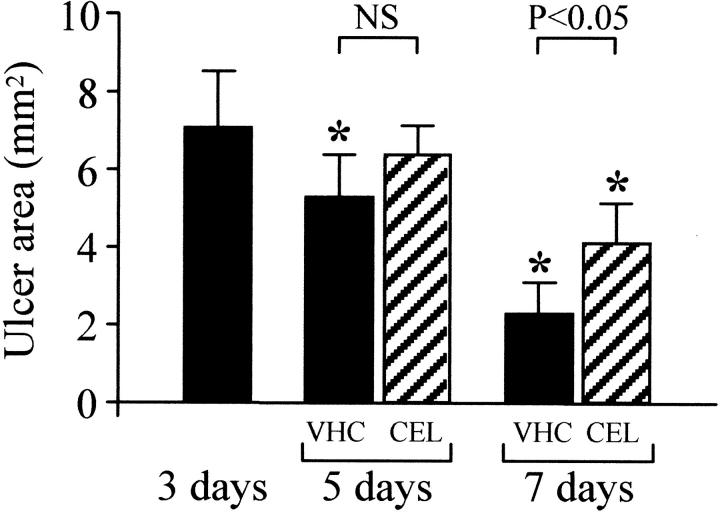
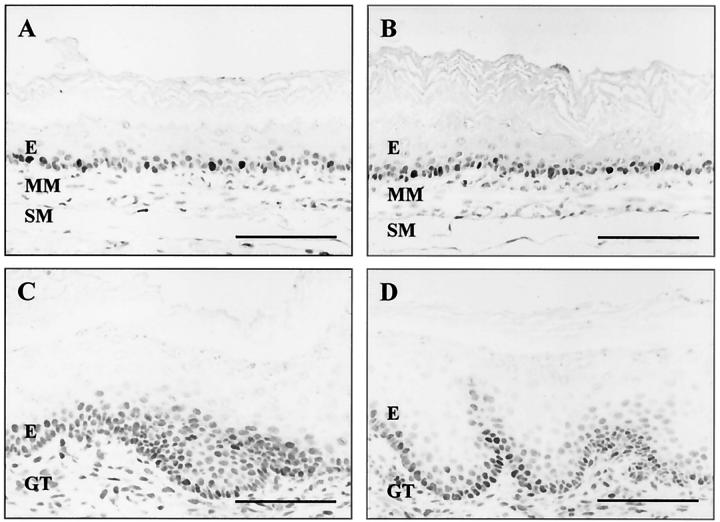
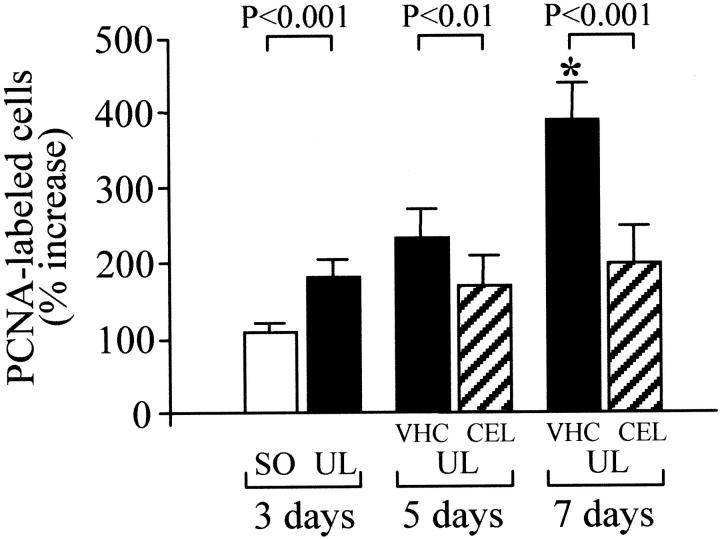
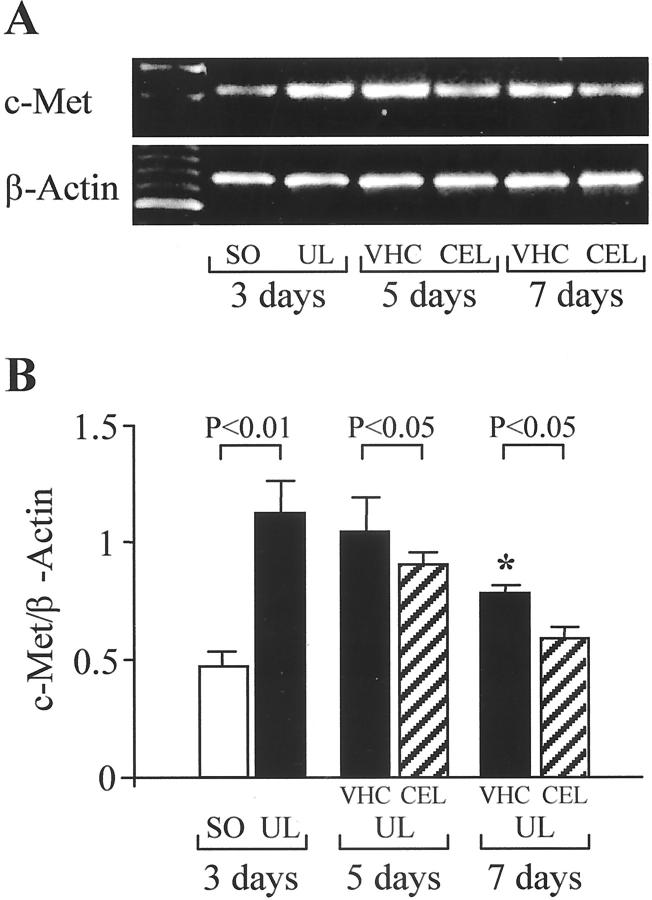
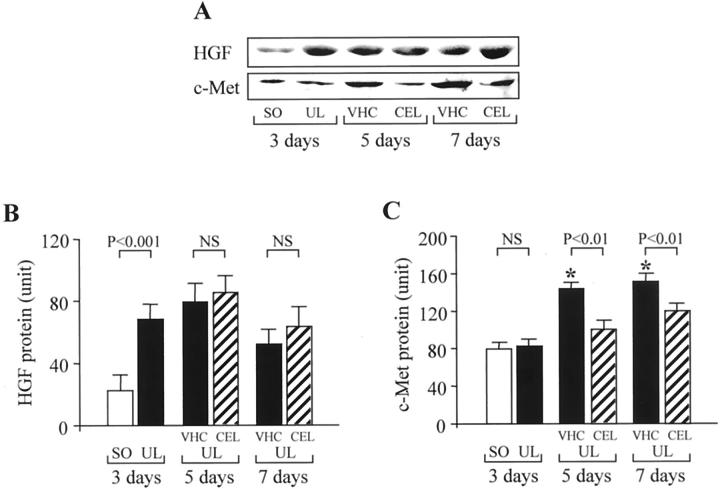
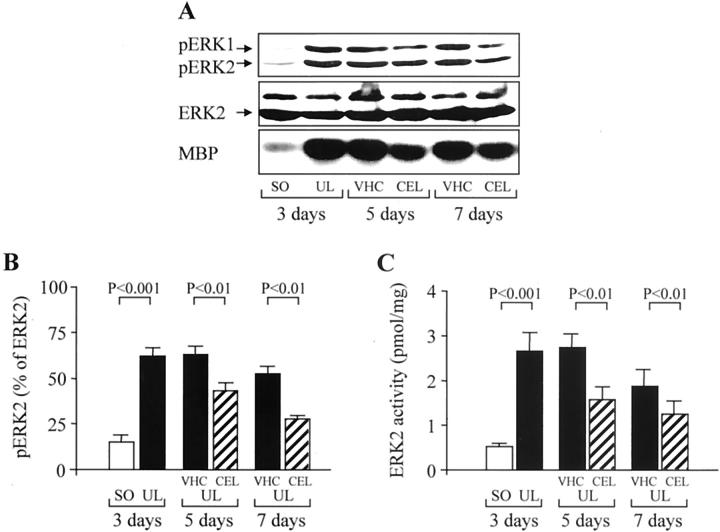
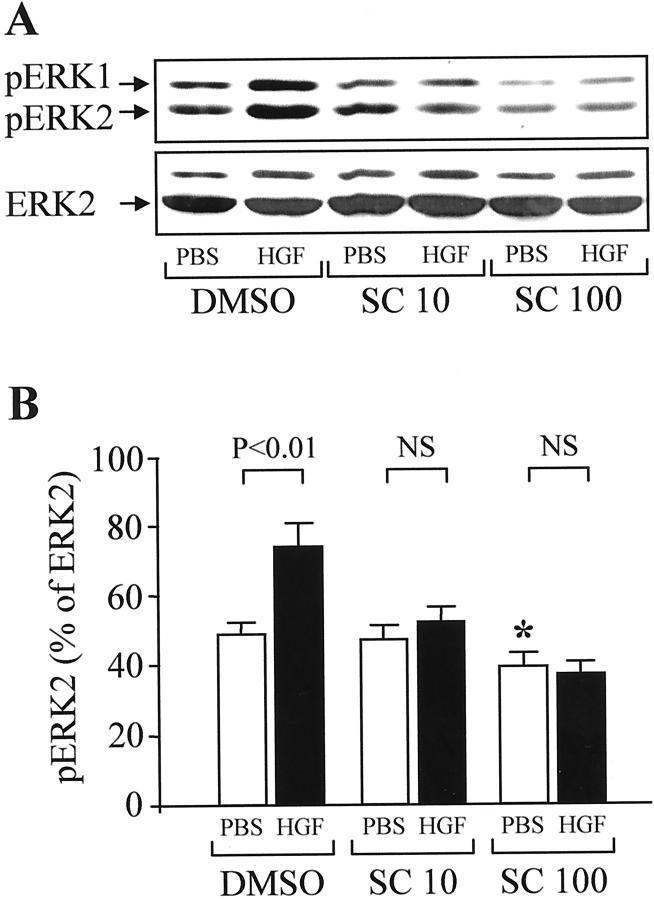
Nonsteroidal anti-inflammatory drugs, both nonselective and cyclooxygenase-2 (COX-2) selective, delay gastric ulcer healing. Whether they affect esophageal ulcer healing remains unexplored. We studied the effects of the COX-2 selective inhibitor, celecoxib, on esophageal ulcer healing as well as on the cellular and molecular events involved in the healing process. Esophageal ulcers were induced in rats by focal application of acetic acid. Rats with esophageal ulcers were treated intragastrically with either celecoxib (10 mg/kg, once daily) or vehicle for 2 or 4 days. Esophageal ulceration triggered increases in: esophageal epithelial cell proliferation; expression of COX-2 (but not COX-1); hepatocyte growth factor (HGF) and its receptor, c-Met; and activation of extracellular signal-regulated kinase 2 (ERK2). Treatment with celecoxib significantly delayed esophageal ulcer healing and suppressed ulceration-triggered increases in esophageal epithelial cell proliferation, c-Met mRNA and protein expression, and ERK2 activity. In an ex vivo organ-culture system, exogenous HGF significantly increased ERK2 phosphorylation levels in esophageal mucosa. A structural analog of celecoxib, SC-236, completely prevented this effect. These findings indicate that celecoxib delays esophageal ulcer healing by reducing ulceration-induced esophageal epithelial cell proliferation. These actions are associated with, and likely mediated by, down-regulation of the HGF/c-Met-ERK2 signaling pathway.
Figures
Similar articles
-
Chronic gastric ulcer healing in rats subjected to selective and non-selective cyclooxygenase-2 inhibitors.Eur J Pharmacol. 2002 May 3;442(1-2):125-35. doi: 10.1016/s0014-2999(02)01494-2. Eur J Pharmacol. 2002. PMID: 12020690
-
HGF triggers activation of the COX-2 gene in rat gastric epithelial cells: action mediated through the ERK2 signaling pathway.FASEB J. 1999 Dec;13(15):2186-94. doi: 10.1096/fasebj.13.15.2186. FASEB J. 1999. PMID: 10593866
-
Novel mechanisms and signaling pathways of esophageal ulcer healing: the role of prostaglandin EP2 receptors, cAMP, and pCREB.Am J Physiol Gastrointest Liver Physiol. 2014 Sep 15;307(6):G602-10. doi: 10.1152/ajpgi.00177.2014. Epub 2014 Jul 24. Am J Physiol Gastrointest Liver Physiol. 2014. PMID: 25059824 Free PMC article.
-
Celecoxib, a selective cyclooxygenase-2 inhibitor for the treatment of rheumatoid arthritis and osteoarthritis.Clin Ther. 1999 Sep;21(9):1497-513; discussion 1427-8. doi: 10.1016/s0149-2918(00)80005-3. Clin Ther. 1999. PMID: 10509845 Review.
-
Mucosal repair and COX-2 inhibition.Curr Pharm Des. 2003;9(27):2207-11. doi: 10.2174/1381612033454027. Curr Pharm Des. 2003. PMID: 14529401 Review.
Cited by
-
A critical role of serum response factor in myofibroblast differentiation during experimental oesophageal ulcer healing in rats.Gut. 2007 May;56(5):621-30. doi: 10.1136/gut.2006.106674. Epub 2006 Oct 26. Gut. 2007. PMID: 17068115 Free PMC article.
-
Roles of cyclooxygenase 2 and microsomal prostaglandin E synthase 1 in rat acid reflux oesophagitis.Gut. 2006 Apr;55(4):450-6. doi: 10.1136/gut.2005.081943. Epub 2005 Oct 6. Gut. 2006. PMID: 16210398 Free PMC article.
-
Rebamipide reduces delay in gastric ulcer healing in cyclooxygenase-2-deficient mice.Dig Dis Sci. 2005 Oct;50 Suppl 1:S63-9. doi: 10.1007/s10620-005-2808-1. Dig Dis Sci. 2005. PMID: 16184423
-
A Rare Case of Sunitinib-Induced Exfoliative Esophagitis.ACG Case Rep J. 2016 Nov 23;3(4):e155. doi: 10.14309/crj.2016.128. eCollection 2016 Aug. ACG Case Rep J. 2016. PMID: 27921054 Free PMC article.
-
Hepatic stellate cells promote hepatocyte engraftment in rat liver after prostaglandin-endoperoxide synthase inhibition.Gastroenterology. 2009 Jun;136(7):2356-64. doi: 10.1053/j.gastro.2009.03.003. Epub 2009 Mar 18. Gastroenterology. 2009. PMID: 19303017 Free PMC article.
References
-
- Wang JY, Yamasaki S, Takeuchi K, Okabe S: Delayed healing of acetic acid-induced gastric ulcers in rats by indomethacin. Gastroenterology 1989, 96:393-402 - PubMed
-
- Tarnawski A, Stachura J, Douglass TG, Krause WJ, Gergely H, Sarfeh IJ: Indomethacin impairs quality of experimental gastric ulcer healing: a quality histologic and ultrastructural analysis. Garner A O’Brien PE eds. Mechanism of Injury, Protection and Repair of the Upper Gastrointestinal Tract. 1991, :pp 521-531 J. Willey & Sons, Chichester
-
- Schmassmann A, Tarnawski A, Peskar BM, Varga L, Flogerzi B, Halter F: Influence of acid and angiogenesis on kinetics of gastric ulcer healing in rats: interaction with indomethacin. Am J Physiol 1995, 268:G276-G285 - PubMed
-
- Levi S, Goodlad RA, Lee CY, Stamp G, Walport MJ, Wright NA, Hodgson HJ: Inhibitory effect of non-steroidal anti-inflammatory drugs on mucosal cell proliferation associated with gastric ulcer healing. Lancet 1990, 336:840-843 - PubMed
-
- Tarnawski A: Cellular mechanisms of gastric ulcer healing. Domschke W Konturek SJ eds. The Stomach. 1993, :pp 177-192 New York, Springer-Verlag, Berlin
Publication types
MeSH terms
Substances
LinkOut - more resources
Full Text Sources
Other Literature Sources
Medical
Research Materials
Miscellaneous
