Comparative Study
. 2002 Mar;128(3):896-910.
doi: 10.1104/pp.010681.

Comparison of RNA expression profiles based on maize expressed sequence tag frequency analysis and micro-array hybridization

Affiliations
Comparative Study

Comparison of RNA expression profiles based on maize expressed sequence tag frequency analysis and micro-array hybridization

John Fernandes et al. Plant Physiol. 2002 Mar.

Abstract

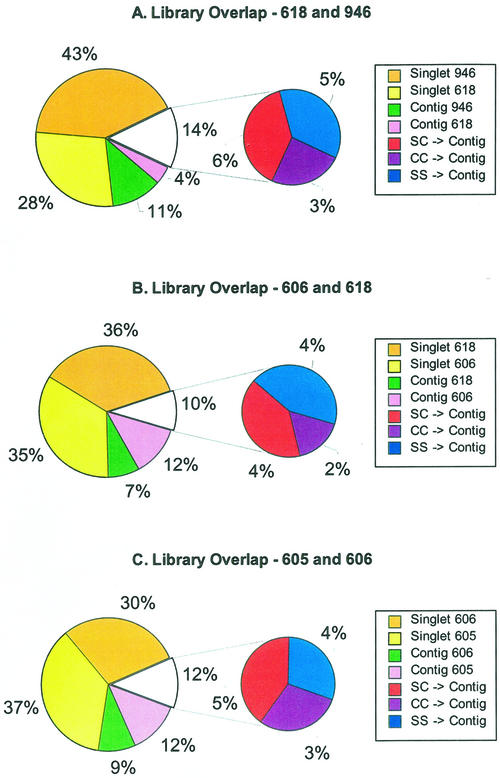
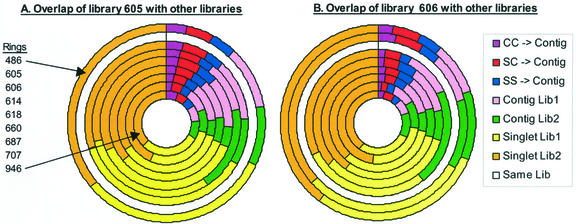
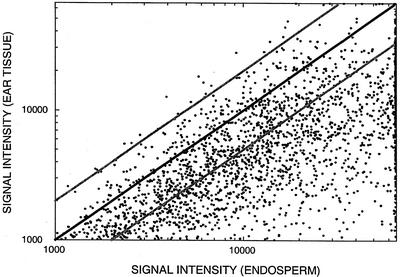
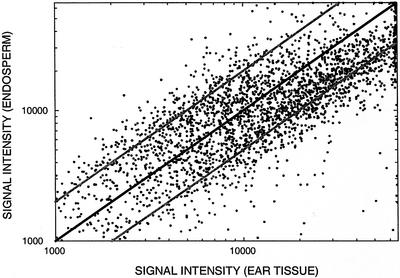
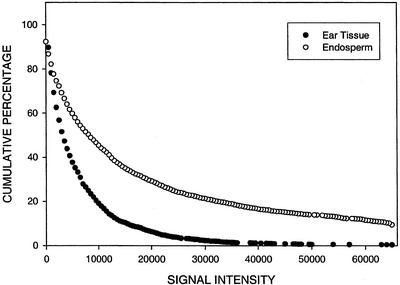
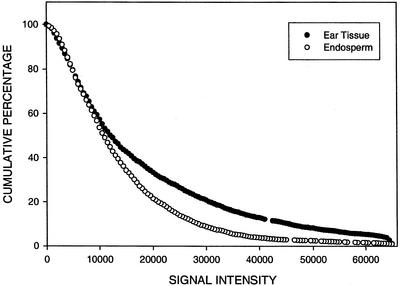
Assembly of 73,000 expressed sequence tags (ESTs) representing multiple organs and developmental stages of maize (Zea mays) identified approximately 22,000 tentative unique genes (TUGs) at the criterion of 95% identity. Based on sequence similarity, overlap between any two of nine libraries with more than 3,000 ESTs ranged from 4% to 20% of the constituent TUGs. The most abundant ESTs were recovered from only one or a minority of the libraries, and only 26 EST contigs had members from all nine EST sets (presumably representing ubiquitously expressed genes). For several examples, ESTs for different members of gene families were detected in distinct organs. To study this further, two types of micro-array slides were fabricated, one containing 5,534 ESTs from 10- to 14-d-old endosperm, and the other 4,844 ESTs from immature ear, estimated to represent about 2,800 and 2,500 unique genes, respectively. Each array type was hybridized with fluorescent cDNA targets prepared from endosperm and immature ear poly(A(+)) RNA. Although the 10- to 14-d-old postpollination endosperm TUGs showed only 12% overlap with immature ear TUGs, endosperm target hybridized with 94% of the ear TUGs, and ear target hybridized with 57% of the endosperm TUGs. Incomplete EST sampling of low-abundance transcripts contributes to an underestimate of shared gene expression profiles. Reassembly of ESTs at the criterion of 90% identity suggests how cross hybridization among gene family members can overestimate the overlap in genes expressed in micro-array hybridization experiments.


Figures

Figure 1
Figure 1
Comparison of TUG overlap between three pairs of cDNA libraries. The first section (starting at the top and moving counterclockwise) of the larger pie chart in each panel represents the singlets unique to the second library. The second section represents the singlets unique to the first library. The third and fourth sections represent the contigs unique to the second and first libraries, respectively. The smaller pie charts in each panel represent the TUGs containing ESTs from both libraries. The three sections of each smaller pie chart represent TUGs with one EST from both libraries (“SS → C”), one EST from one library, and multiple ESTs from the second library (“SC → C”), and multiple ESTs from both libraries (“CC → C”). In A, 1-mm tassel primordia (library 946) is compared with 0.5- to 2.0-cm tassels encompassing stages of organ specification and early differentiation (library 618). In B, library 618 is compared with 1- to 2-cm immature ear (library 606) containing similar stages of organ differentiation. In C, library 606 is compared with developing endosperm 10 to 14 d postpollination (library 605).
Figure 2
Figure 2
Multiple pair-wise comparisons of TUG overlap between one EST library and each of the eight other EST libraries listed in Table I. A, Comparison of the endosperm library (605) with the other libraries with each ring representing a comparison between library 605 and one other library. The order of the library comparisons is listed in the figure, starting with the outermost ring (library 486). B, Comparison of the immature ear library (606) with the other libraries. The first three sections of each ring (starting at the top and moving clockwise) correspond in color and meaning to the sections of the smaller pie charts in Figure 1. As in Figure 1, these three sections represent TUG overlap between the two libraries. The next four sections correspond in color and meaning to the sections of the larger pie charts in Figure 1.
Figure 3
Figure 3
Analysis of the reproducibility of measurement of fluorescence ratio values using the 606 ear tissue micro-array, as a function of the absolute values of the ratio numerator. Reproducibility is expressed in terms of the coefficient of variation of the three ratio values measured for each replicated array element.
Figure 4
Figure 4
Hybridization signal intensity (fluorescence units) of endosperm and ear RNA to each TUG on an endosperm micro-array. For contigs, which are comprised of two or more ESTs, hybridization signal intensity is represented by the maximum signal intensity of all ESTs in the contig. The black line indicates equivalent signal intensities. Gray lines indicate 2-fold differences in signal intensity. Data for TUGs with hybridization signals less than 1,000 fluorescence units are omitted.
Figure 5
Figure 5
Hybridization signal intensity (fluorescence units) of ear and endosperm RNA to each TUG on an ear micro-array. For contigs, hybridization signal intensity is represented by the maximum signal intensity of all ESTs in the contig. The black line indicates equivalent signal intensities. Gray lines indicate 2-fold differences in signal intensity. Data for TUGs with hybridization signals less than 1,000 fluorescence units are omitted.
Figure 6
Figure 6
The cumulative percentage of TUGs that hybridize with endosperm and ear RNA as a function of hybridization signal intensity (fluorescence units) on an endosperm micro-array. For contigs (comprised of two or more ESTs), hybridization signal intensity is represented by the maximum signal intensity of all ESTs in the contig. The total number of TUGs is 2,800.
Figure 7
Figure 7
The cumulative percentage of TUGs that hybridize with ear and endosperm RNA as a function of hybridization signal intensity (fluorescence units) on an ear micro-array. For contigs (comprised of two or more ESTs) hybridization signal intensity is represented by the maximum signal intensity of all ESTs in the contig. The total number of TUGs is 2,553.

References

    1. Alfenito MR, Souer E, Buell R, Koes R, Mol J, Walbot V. Functional complementation of anthocyanin sequestration in the vacuole by widely divergent glutathione S-transferases. Plant Cell. 1998;10:1135–1149. - PMC - PubMed
    1. Altschul SF, Madden TL, Schaffer AA, Zhang J, Zhang Z, Miller W, Lipman DJ. Gapped BLAST and PSI-BLAST: a new generation of protein database search programs. Nucleic Acids Res. 1997;25:3389–3402. - PMC - PubMed
    1. Arabidopsis Genome Initiative. Analysis of the genome sequence of the flowering plant Arabidopsis thaliana. Nature. 2000;408:796–815. - PubMed
    1. Brown AJP, Planta RJ, Restuhadi F, Bailey DA, Butler PR, Cadahia JL, Cerdan ME, DeJonge M, Gardner DCJ, Gent ME et al. Transcript analysis of 1003 novel yeast genes using high-throughput northern hybridizations. EMBO J. 2001;20:3177–3186. - PMC - PubMed
    1. Bruce W, Folkerts O, Garnaat C, Crasta O, Roth B, Bowen B. Expression profiling of the maize flavonoid pathway genes controlled by estradiol-inducible transcription factors CRC and P. Plant Cell. 2000;12:65–79. - PMC - PubMed

Publication types