Comparative Study
. 2002 Mar 19;99(6):3586-90.
doi: 10.1073/pnas.062527199. Epub 2002 Mar 12.

Embryonic stem cells and somatic cells differ in mutation frequency and type

Affiliations
Comparative Study

Embryonic stem cells and somatic cells differ in mutation frequency and type

Rachel B Cervantes et al. Proc Natl Acad Sci U S A. .

Abstract

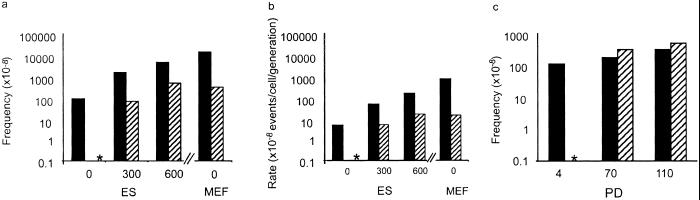
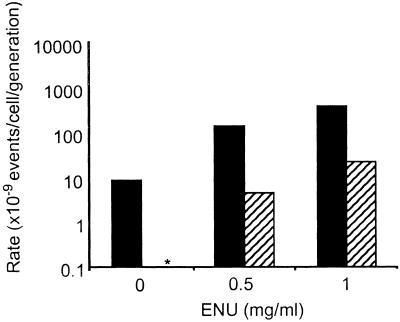
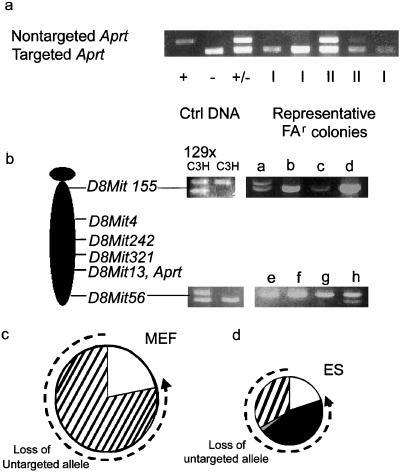
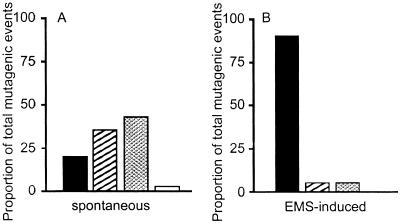
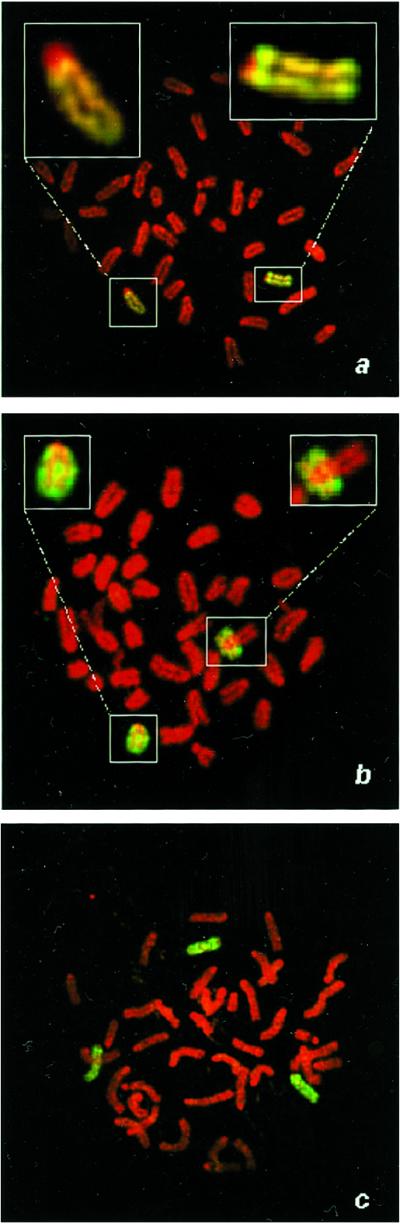
Pluripotent embryonic stem (ES) cells have been used to produce genetically modified mice as experimental models of human genetic diseases. Increasingly, human ES cells are being considered for their potential in the treatment of injury and disease. Here we have shown that mutation in murine ES cells, heterozygous at the selectable Aprt locus, differs from that in embryonic somatic cells. The mutation frequency in ES cells is significantly lower than that in mouse embryonic fibroblasts, which is similar to that in adult cells in vivo. The distribution of spontaneous mutagenic events is remarkably different between the two cell types. Although loss of the functional allele is the predominant mutation type in both cases, representing about 80% of all events, mitotic recombination accounted for all loss of heterozygosity events detected in somatic cells. In contrast, mitotic recombination in ES cells appeared to be suppressed and chromosome loss/reduplication, leading to uniparental disomy (UPD), represented more than half of the loss of heterozygosity events. Extended culture of ES cells led to accumulation of cells with adenine phosphoribosyltransferase deficiency and UPD. Because UPD leads to reduction to homozygosity at multiple recessive disease loci, including tumor suppressor loci, in the affected chromosome, the increased risk of tumor formation after stem cell therapy should be viewed with concern.


Figures

Figure 1
Figure 1
The mutant frequency and mutation rate are lower in ES cells than in MEFs. (a) ES cells and MEFs heterozygous at the Aprt locus were either treated with the indicated concentration of ethyl methanesulfonate (EMS, μg/ml) for a period of 5 h to measure EMS-induced mutant frequency or remained untreated to measure spontaneous mutant frequency. Mutant frequency is corrected for colony-forming efficiency. SEM is indicated. Solid bars indicate Aprt mutant frequency, and hatched bars represent Hprt mutant frequency. The asterisk indicates that no spontaneously arising Hprt mutants were detected (mutation frequency <10−8). (b) Preexisting APRT and HPRT mutants were eliminated in ES cell and MEF cultures, which were then treated with EMS or left untreated as described in a. Mutation rate was calculated as previously described, but adapted for mammalian cells (13) and corrected for colony-forming efficiency. Solid bars indicate Aprt mutation rate and hatched bars represent Hprt mutation rate. The asterisk indicates that no spontaneously arising Hprt mutants were detected (mutation rate < 10−9). The differences between Aprt and Hprt mutant frequency and mutation rate were analyzed by Student's t test (P = 0.002). Differences in Aprt mutation frequency and rate between ES cells and MEFs were also statistically significant as analyzed by t test (P = 0.0004). (c) Mutant frequency at Aprt in ES cells increases with number of population doublings (PD). Solid bars indicated observed mutant frequency; hatched bars indicated predicted mutant frequency based on mutation rate. Asterisk indicates that no expected measurement is determined.
Figure 2
Figure 2
ES cell mutation rate at Aprt and Hprt both increase after exposure to ENU. ES cells heterozygous at the Aprt locus were either treated with the indicated concentration of ENU (μg/ml) for a period of 5 h to measure ENU-induced mutant frequency or remained untreated to measure spontaneous mutant frequency. Mutation rate was calculated as previously described (13) and corrected for colony-forming efficiency. SEM is indicated. Solid bars indicate Aprt mutation rate, and hatched bars represent Hprt mutation rate. The asterisk indicates that no spontaneously arising Hprt mutants were detected (mutation rate <10−9).
Figure 3
Figure 3
ES cells and MEFs have distinctly different spectra of mutation. (a) ES cell and MEF variants were designated as class I (loss of the untargeted Aprt allele) or class II (retention of the untargeted Aprt allele) based on allele-specific PCR. PCR of the untargeted Aprt allele yields a 700-bp product; the targeted allele yields a 300-bp product. The +/+, −/−, and +/− controls were derived from wild type, null, and heterozygous (parental) ES cells, respectively. Class I variants and class II variants are designated “I” and “II” below their respective lanes. (b) PCR of informative microsatellite markers was used to define the mechanism of LOH in class I variants. D8Mit155 (1 centimorgan) and D8Mit 56 (73 centimorgan) are markers at the most centromeric and telomeric regions of mouse chromosome 8. 129SvEv × C3H: parental control; C3H: C3H genomic DNA control; a–h: representative FAr class I variants. (c) Distribution of mutation types in MEFs. (d) Distribution of mutation types in ES cells. Dashed line indicates mutagenic mechanisms contributing to loss of the untargeted Aprt allele. □, Point mutation/epigenetic inactivation; ■, chromosome loss and reduplication (nondisjunction); ▨, mitotic recombination; ▩, gene conversion/multilocus deletion/double crossover.
Figure 4
Figure 4
Distribution of spontaneous (A) and EMS-induced (B) mutational events in ES cells. □, Intragenic mutation; ▨, mitotic recombination; ▩, chromosome loss/reduplication (nondisjunction); □, double crossover/gene conversion/deletion.
Figure 5
Figure 5
UPD is the major mechanism of mutation in ES cells. (a) A metaphase spread from a parental 129SvEv × C3H ES cell heterozygous at Aprt was hybridized with a paint specific for chromosome 8. Two chromosomes 8 are pictured, one with a large centromere (C3H parental origin, Left Inset) and one with small centromere (129SvEv parental, Right Inset). (b) Class I ES cell variant exhibiting UPD possesses two chromosomes 8 of 129SvEv parental origin (Insets). (c) Class I ES cell variant exhibiting trisomy 8.

References

    1. Nagy A, Rossant J, Nagy R, Abramow-Newerly W, Roder J C. Proc Natl Acad Sci USA. 1993;90:8424–8428. - PMC - PubMed
    1. Brook F A, Gardner R L. Proc Natl Acad Sci USA. 1997;94:5709–5712. - PMC - PubMed
    1. Vrieling H, Wijnhoven S, van Sloun P, Kool H, Giphart-Gassler M, van Zeeland A. Environ Mol Mutagen. 1999;34:84–89. - PubMed
    1. Tischfield J A. Am J Hum Genet. 1997;61:995–999. - PMC - PubMed
    1. Stambrook P J, Shao C, Stockelman M, Boivin G, Engle S J, Tischfield J A. Environ Mol Mutagen. 1996;28:471–482. - PubMed

Publication types

MeSH terms

Substances