. 2002 Mar 15;22(6):2165-73.
doi: 10.1523/JNEUROSCI.22-06-02165.2002.

Synaptically released glutamate activates extrasynaptic NMDA receptors on cells in the ganglion cell layer of rat retina

Affiliations

Synaptically released glutamate activates extrasynaptic NMDA receptors on cells in the ganglion cell layer of rat retina

Shan Chen et al. J Neurosci. .

Abstract

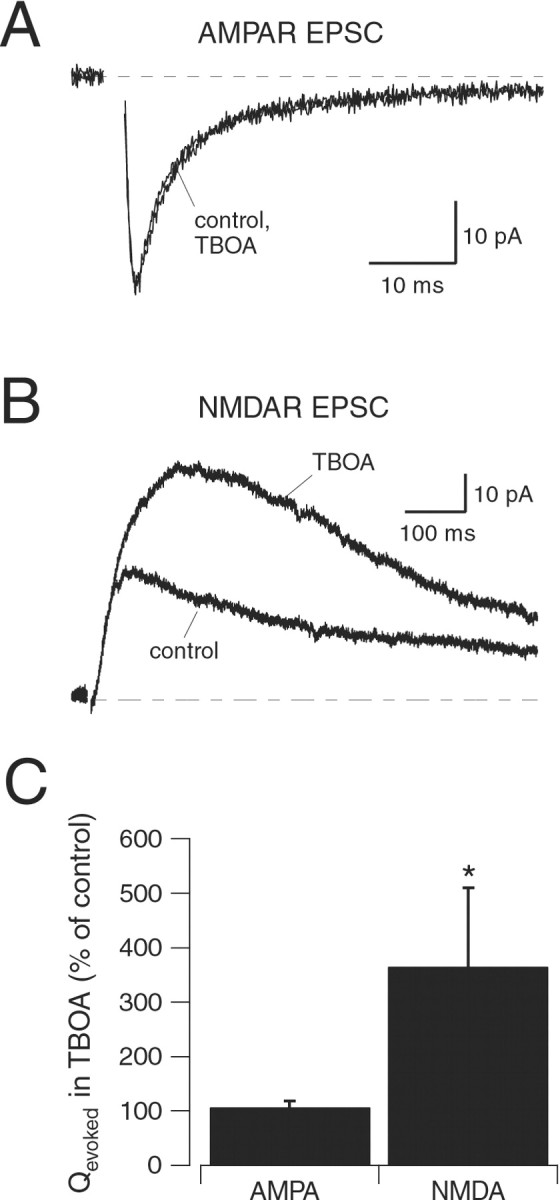
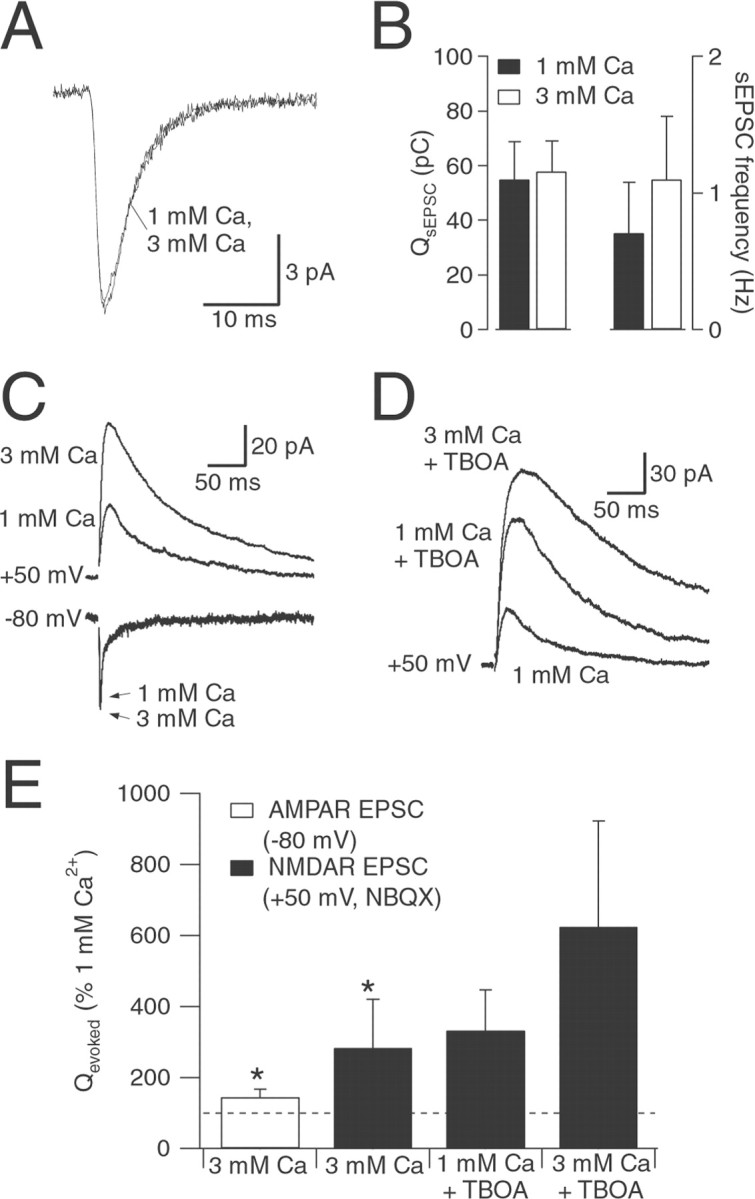
NMDA and AMPA receptors (NMDARs and AMPARs) are colocalized at most excitatory synapses in the CNS. Consequently, both receptor types are activated by a single quantum of transmitter and contribute to miniature and evoked EPSCs. However, in amphibian retina, miniature EPSCs in ganglion cell layer neurons are mediated solely by AMPARs, although both NMDARs and AMPARs are activated during evoked EPSCs. One explanation for this discrepancy is that NMDARs are located outside of the synaptic cleft and are activated only when extrasynaptic glutamate levels increase during coincident release from multiple synapses. Alternatively, NMDARs may be segregated at synapses that either are not spontaneously active or yield miniature EPSCs that are too small to detect. In this study, we examined excitatory, glutamatergic synaptic inputs to neurons in the ganglion cell layer of acute slices of rat retina. EPSCs, elicited by electrically stimulating presynaptic bipolar cells, exhibited both NMDAR- and AMPAR-mediated components. However, spontaneous EPSCs exhibited only an AMPAR-mediated component. The effects of low-affinity, competitive receptor antagonists indicated that NMDARs encounter less glutamate than AMPARs during an evoked synaptic response. Reducing glutamate uptake or changing the probability of release preferentially affected the NMDAR component in evoked EPSCs; reducing uptake revealed an NMDAR component in spontaneous EPSCs. These results indicate that NMDARs are located extrasynaptically and that glutamate transporters prevent NMDAR activation by a transmitter released from a single vesicle and limit their activation during evoked responses.


Figures

Fig. 1.
Fig. 1.
Electrically evoked EPSCs in rat GCLs are shown.A, Infrared differential interference contrast image of a rat retinal slice. A bipolar stimulating electrode is positioned in the outer plexiform layer (OPL; one pole visible,left). A ganglion cell layer (GCL) was patched and filled with Lucifer yellow (right); the fluorescence image has been superimposed. The axonal process just below the soma (arrow) indicates that this cell is probably a ganglion cell. INL, Inner nuclear layer.B, Evoked EPSCs (holding potential, −80 mV) were blocked reversibly by the calcium channel blocker CdCl2 (20 μm). C, EPSCs (−80 mV) were blocked by the non-NMDA receptor antagonist DNQX (10 μm).D, EPSCs were blocked by GYKI (25 μm), an AMPAR antagonist.
Fig. 2.
Fig. 2.
Electrically evoked EPSCs exhibit AMPAR and NMDAR components. A, EPSCs recorded at holding potentials (in millivolts) are indicated at left.Dashed lines indicate the early (circles) and late (squares) time points at which EPSC amplitudes were measured in B. Stimulus artifacts have been removed for clarity. B, The early component of the EPSC (circles) exhibited an ohmic conductance typical of the AMPAR, whereas the late component (squares) exhibited the J-shaped conductance signature of the NMDAR (Mayer et al., 1984;Nowak et al., 1984). Similar results were observed in seven cells.C, The AMPAR antagonist NBQX (5 μm) blocked the entire EPSC at −80 mV and the early component at +40 mV. Similar results were observed in six cells. D, The NMDAR antagonist CPP exerted little effect at −80 mV and blocked a slow component at +40 mV. Similar results were observed in six cells.
Fig. 3.
Fig. 3.
Spontaneous EPSCs do not exhibit an NMDAR component. A, EPSCs evoked in control solution at holding potentials of −80 and +40 mV. B, The charge transferred during EPSCs (Qevoked) at +40 mV was significantly greater than at −80 mV. C, Representative recordings showing spontaneous activity at −80 and +50 mV. Inset, Average sEPSC at −80 mV (inward trace, average of 101 events from one cell) and +50 mV (outward trace, average of 65 events from the same cell). D, Average charge transfer (Qspont) at −80 and +50 mV (n = 5). Bar on rightindicates data at +50 mV scaled to reflect an 80 mV driving force.E, Effect on EPSCs of superfusing the slice with nominally Mg-free extracellular solution. F, Comparison of Qevoked in control and nominally Mg-free solution. G, Representative recordings of spontaneous activity (−80 mV) in control solution, nominally Mg-free solution, and Mg-free solution plus 10 μm DNQX. Inset, Average sEPSCs from one cell in control (n = 291 events) and nominally Mg-free solution (n = 284 events). H, Qspont in control solution and in nominally Mg-free solution (n = 7).Asterisks indicate a statistically significant difference compared with control (p < 0.05).
Fig. 4.
Fig. 4.
NMDARs encounter less synaptically released glutamate than AMPARs. A, AMPAR responses (NMDARs blocked with 5 μm CPP) in outside-out patches to brief pulses (1–2 msec) of l-glutamate (1 mm) in control solution and in the continuous presence of γ-DGG (500 μm; holding potential, −80 mV). Top trace, Open-tip current across open electrode, indicating the speed of solution exchange across the pipette tip. B, Evoked AMPAR EPSCs (5 μm CPP) recorded in control solution and in the presence of γ-DGG (500 μm; holding potential, −80 mV). Stimulus artifacts have been removed for clarity.C, As in A, except that NMDARs were isolated (5 μm NBQX), and the effects ofl-AP-5 (200 μm) were tested (holding potential, +50 mV). D, Evoked NMDAR EPSCs (5 μm NBQX) recorded in control solution and in the presence of l-AP-5 (200 μm; holding potential, +50 mV). Inset, EPSC recorded from the same neuron at −80 mV. Calibration: 25 pA, 30 msec. E, Effects of 500 μm γ-DGG on patch currents (n = 6) and evoked EPSCs (n = 6). F, Effects of 200 μml-AP-5 on patch currents (n = 6) and evoked EPSCs (n = 5). The asterisk indicates a statistically significant difference compared with control (p < 0.05).
Fig. 5.
Fig. 5.
Glutamate transporters limit synaptic activation of NMDARs. A, Evoked AMPAR EPSCs recorded in control (5 μm CPP) and in the presence of 10 μm TBOA (holding potential, −80 mV). B, Evoked NMDAR EPSCs recorded in control (5 μm NBQX) and in the presence of 10 μm TBOA (holding potential, +40 mV). C, Effects of TBOA on Qevoked of AMPAR EPSCs (n = 5) and NMDAR EPSCs (n = 5). The asterisk indicates a statistically significant difference compared with control (p < 0.05).
Fig. 6.
Fig. 6.
Changing prpreferentially affects NMDAR EPSC. A, Average sEPSCs from one cell in 1 and 3 mm[Ca2+]o. B, Changing [Ca2+]o had no significant effect onQspont (n = 5) but increased sEPSC frequency (frequency in 3 mm[Ca2+]o = 187 ± 101% of frequency in 1 mm[Ca2+]o; n= 5; p = 0.05). C, AMPAR EPSCs (holding potential, −80 mV) and NMDAR EPSCs (holding potential, +50 mV; 5 μm NBQX) in superfusion solution containing either 1 or 3 mm [Ca2+]o.D, Effects on NMDAR EPSCs (holding potential, +50 mV; 5 μm NBQX) of changing [Ca2+]o in the presence of TBOA (10 μm). E, Summary of effects of changing [Ca2+]o in the absence (n = 4) and the presence (n = 4) of TBOA (10 μm). Experiments with TBOA were performed in a separate set of cells. Asterisks indicate a statistically significant difference compared with control (p < 0.05).
Fig. 7.
Fig. 7.
Blocking transporters reveals an NMDAR component in sEPSCs. A, Top, Average sEPSCs recorded from one GLC at −80 mV in control extracellular solution (1.3 Mg2+, 62 events), control solution plus 10 μm TBOA (83 events), 0 Mg2+extracellular solution plus 10 μm TBOA (128 events), and 0 Mg2+ extracellular solution plus 10 μm TBOA plus 5 μm CPP (109 events).Left, Average of all events. Center,Average of smallest 20% of events. Right, Average of largest 20% of events. Average sEPSCs in all four conditions are superimposed. A, Bottom, Subtraction of average traces in TBOA/0 Mg2+/CPP from average traces in TBOA/0 Mg2+. B, Summary of the effects of external magnesium, TBOA, and CPP on sEPSCs (n = 5 cells). Asterisks indicate a statistically significant difference compared with control (p < 0.05).

Similar articles

Cited by

References

    1. Aizenman E, Frosch MP, Lipton SA. Responses mediated by excitatory amino acid receptors in solitary retinal ganglion cells from rat. J Physiol (Lond) 1988;396:75–91. - PMC - PubMed
    1. Asztely F, Erdemli G, Kullmann DM. Extrasynaptic glutamate spillover in the hippocampus: dependence on temperature and the role of active glutamate uptake. Neuron. 1997;18:281–293. - PubMed
    1. Auger C, Kondo S, Marty A. Multivesicular release at single functional synaptic sites in cerebellar stellate and basket cells. J Neurosci. 1998;18:4532–4547. - PMC - PubMed
    1. Bekkers JM, Stevens CF. NMDA and non-NMDA receptors are co-localized at individual excitatory synapses in cultured rat hippocampus. Nature. 1989;341:230–233. - PubMed
    1. Berntson A, Taylor WR. Response characteristics and receptive field widths of on-bipolar cells in the mouse retina. J Physiol (Lond) 2000;524:879–889. - PMC - PubMed

Publication types

MeSH terms

LinkOut - more resources