

Odorant-induced olfactory receptor neural oscillations and their modulation of olfactory bulbar responses in the channel catfish
- PMID: 11896174
- PMCID: PMC6758253
- DOI: 10.1523/JNEUROSCI.22-06-02352.2002
Odorant-induced olfactory receptor neural oscillations and their modulation of olfactory bulbar responses in the channel catfish
Abstract
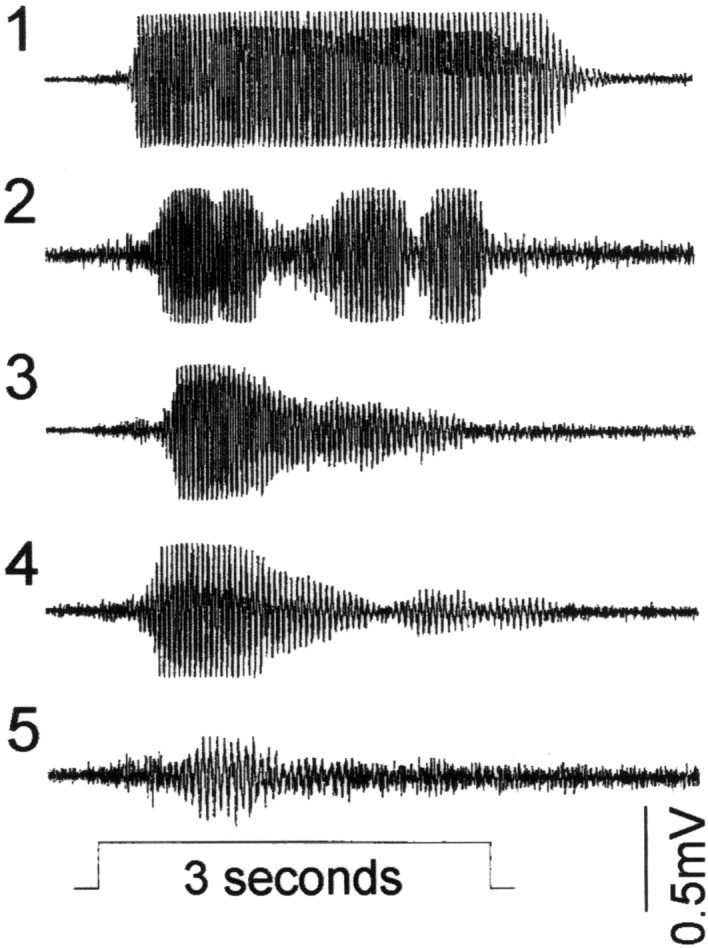
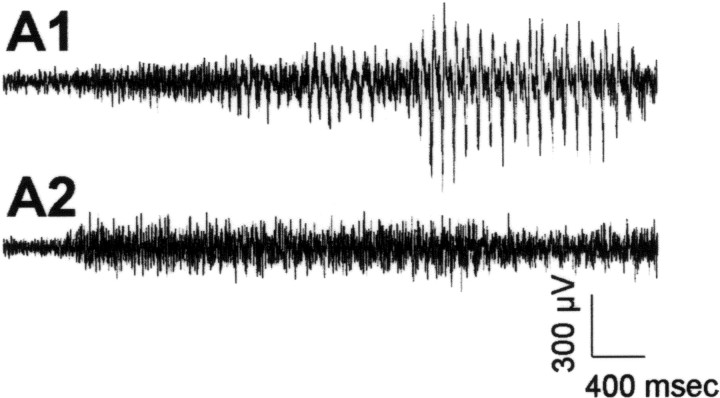
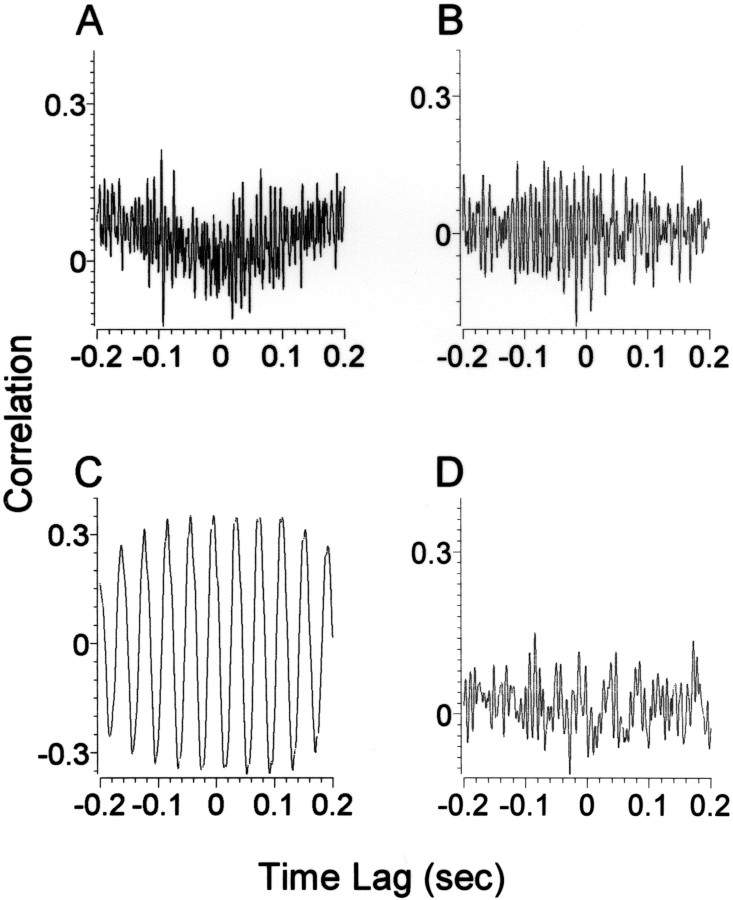
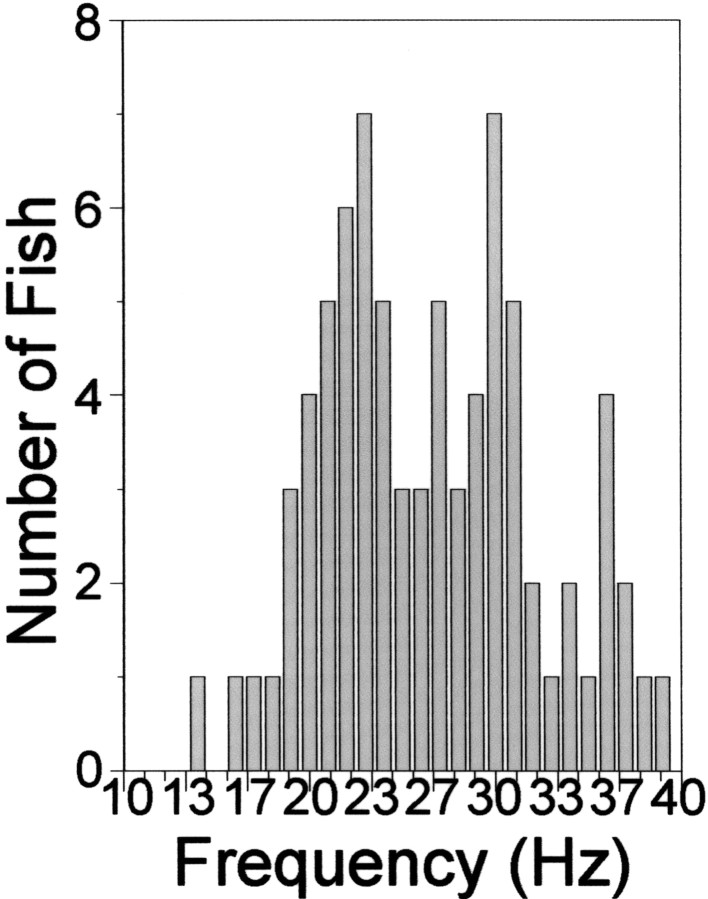
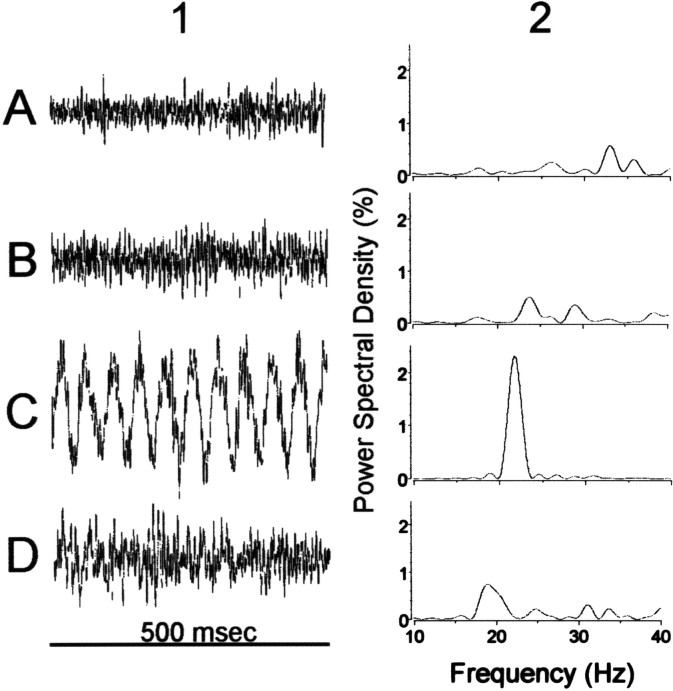
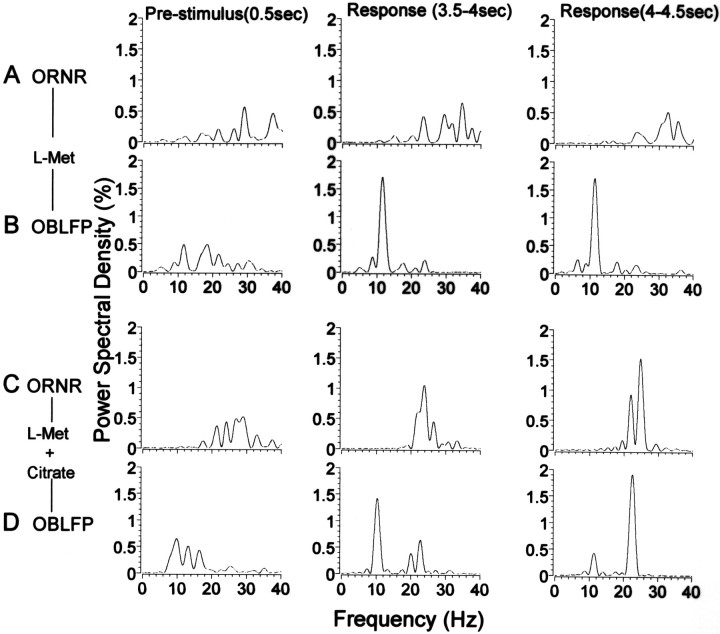
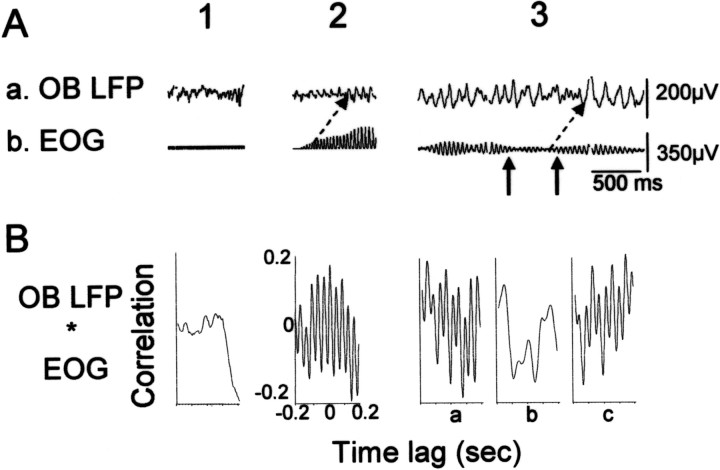
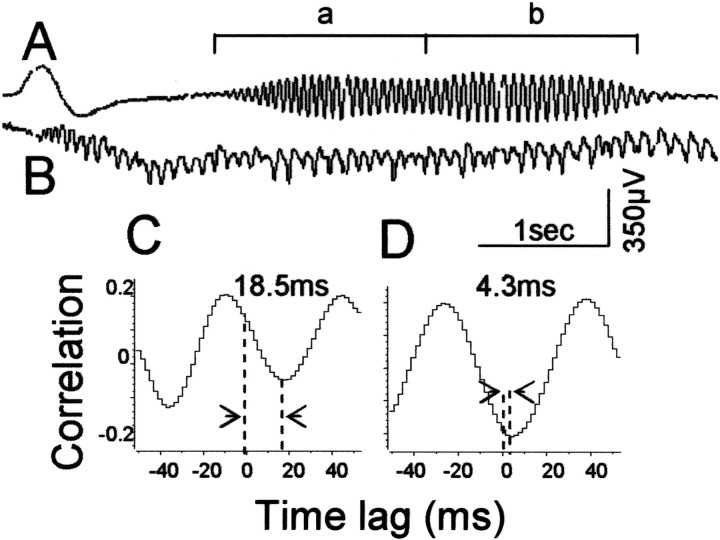
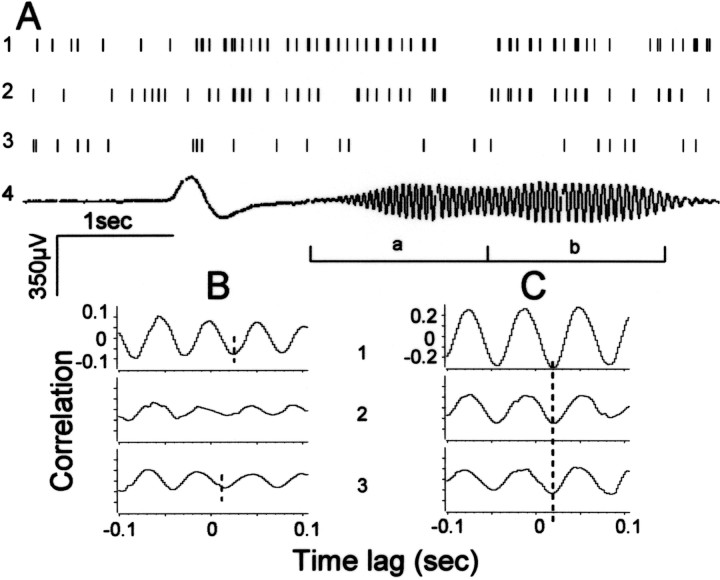
Peripheral waves (PWs) in the channel catfish are odorant-induced neural oscillations of synchronized populations of olfactory receptor neurons (ORNs) that appear after the initial approximately 500 msec of the response. The mean dominant frequency during the initial 2 sec of PW activity is approximately 28 Hz, declining to approximately 20 Hz in the last sec of a 5 sec stimulus. Recordings of PWs from different regions of a single olfactory lamella and simultaneously from widely separated lamellae within the olfactory organ suggest that PWs are initiated in the sensory epithelium within each olfactory lamella. Simultaneous recordings in vivo from the olfactory organ [electro-olfactogram (EOG) or integrated neural activity], local field potentials (LFPs) from the olfactory bulb (OB), and single and few-unit activity from OB neurons were performed. Cross-correlation analysis of simultaneously recorded odor-induced OB LFPs and either EOG or ORN neural activity showed that oscillations occurring within the OB were lower (<20 Hz) than those of PWs; however, during PW activity, OB LFPs increased both their magnitude and dominant frequencies and became correlated with the PWs. Also during odorant-induced PW activity, the responses of different OB neurons with similar odorant specificity became phase locked to each other and to both the PWs and OB LFPs. PWs are hypothesized to function to strengthen the synaptic transfer of olfactory information at specific glomeruli within the OB.
Figures

Similar articles
-
Characterization of electro-olfactogram oscillations and their computational reconstruction.Chem Senses. 2004 Jun;29(5):411-24. doi: 10.1093/chemse/bjh042. Chem Senses. 2004. PMID: 15201208
-
Temporal structure of receptor neuron input to the olfactory bulb imaged in behaving rats.J Neurophysiol. 2009 Feb;101(2):1073-88. doi: 10.1152/jn.90902.2008. Epub 2008 Dec 17. J Neurophysiol. 2009. PMID: 19091924 Free PMC article.
-
Electrophysiological responses of single olfactory bulb neurons to amino acids in the channel catfish, Ictalurus punctatus.J Neurophysiol. 1995 Oct;74(4):1421-34. doi: 10.1152/jn.1995.74.4.1421. J Neurophysiol. 1995. PMID: 8989382
-
Odorant receptors signaling instructs the development and plasticity of the glomerular map.Neural Plast. 2015;2015:975367. doi: 10.1155/2015/975367. Epub 2015 Jan 20. Neural Plast. 2015. PMID: 25688305 Free PMC article. Review.
-
The olfactory bulb: coding and processing of odor molecule information.Science. 1999 Oct 22;286(5440):711-5. doi: 10.1126/science.286.5440.711. Science. 1999. PMID: 10531048 Review.
Cited by
-
Communication call-evoked gamma-band activity in the auditory cortex of awake bats is modified by complex acoustic features.Brain Res. 2008 Jan 10;1188:76-86. doi: 10.1016/j.brainres.2007.10.081. Epub 2007 Nov 4. Brain Res. 2008. PMID: 18054896 Free PMC article.
-
Coordination of central odor representations through transient, non-oscillatory synchronization of glomerular output neurons.Proc Natl Acad Sci U S A. 2003 Sep 16;100(19):11076-81. doi: 10.1073/pnas.1934001100. Epub 2003 Sep 5. Proc Natl Acad Sci U S A. 2003. PMID: 12960372 Free PMC article.
-
Male dominance status regulates odor-evoked processing in the forebrain of a cichlid fish.Sci Rep. 2019 Mar 25;9(1):5083. doi: 10.1038/s41598-019-41521-6. Sci Rep. 2019. PMID: 30911102 Free PMC article.
-
Amplitude modulation patterns of local field potentials reveal asynchronous neuronal populations.J Neurosci. 2007 Aug 22;27(34):9238-45. doi: 10.1523/JNEUROSCI.4512-06.2007. J Neurosci. 2007. PMID: 17715359 Free PMC article.
-
Contribution of action potentials to the extracellular field potential in the nucleus laminaris of barn owl.J Neurophysiol. 2018 Apr 1;119(4):1422-1436. doi: 10.1152/jn.00175.2017. Epub 2017 Dec 20. J Neurophysiol. 2018. PMID: 29357463 Free PMC article.
References
-
- Adrian ED. Potential oscillations in the olfactory organ. J Physiol (Lond) 1955;128:21–22.
-
- Caprio J. In vivo olfactory and taste recordings in fish. In: Spielman AI, Brand JG, editors. Experimental cell biology of taste and olfaction (current techniques and protocols) CRC; Boca Raton, FL: 1995. pp. 251–261.
Publication types
MeSH terms
Substances
Grants and funding
LinkOut - more resources
Full Text Sources
Miscellaneous