

Stimulus encoding and feature extraction by multiple sensory neurons
- PMID: 11896176
- PMCID: PMC6758263
- DOI: 10.1523/JNEUROSCI.22-06-02374.2002
Stimulus encoding and feature extraction by multiple sensory neurons
Abstract
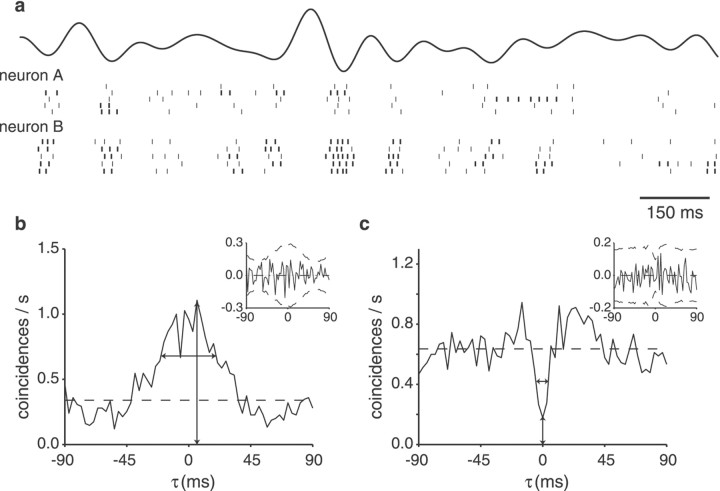
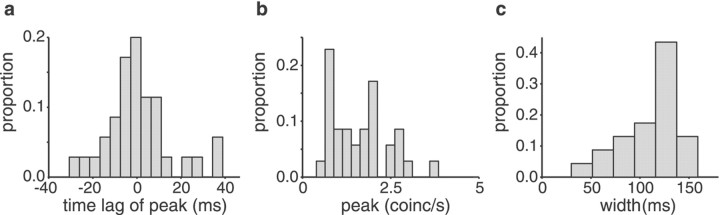
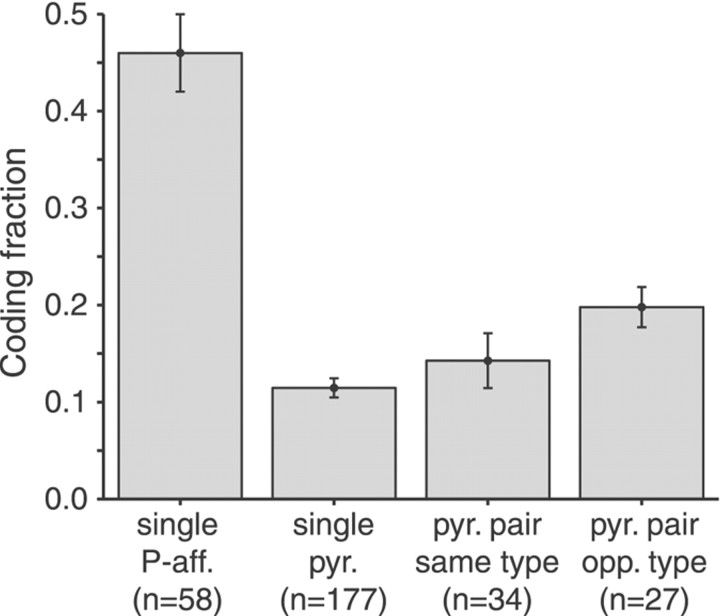
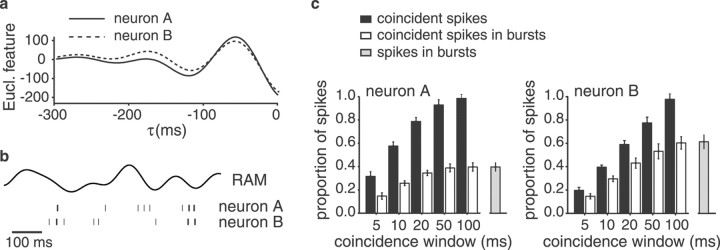
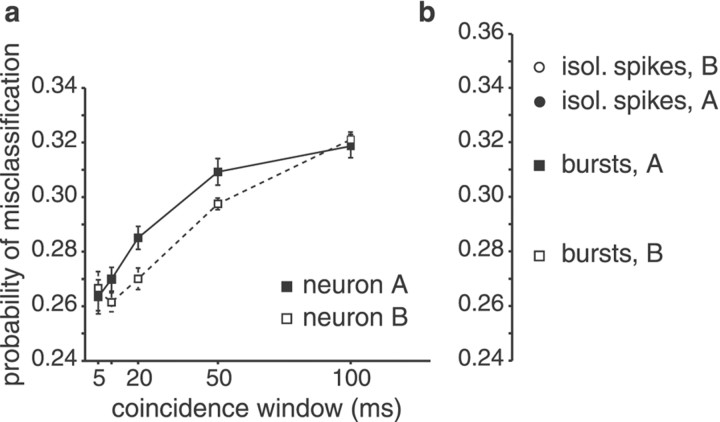
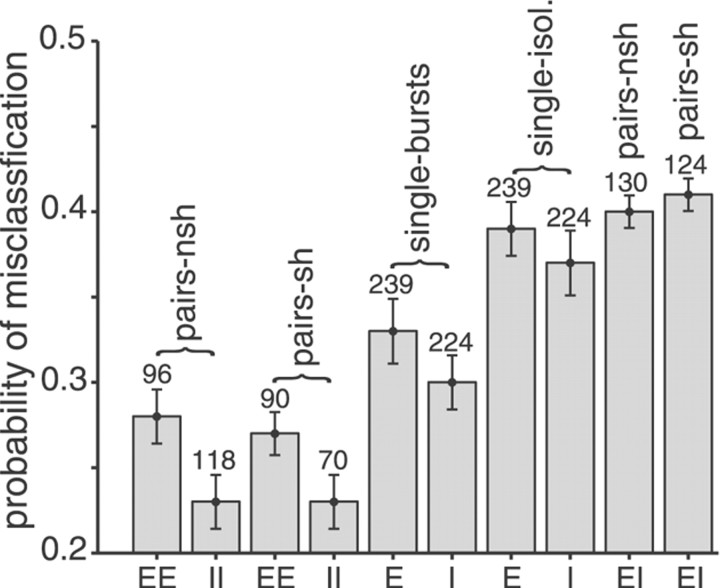
Neighboring cells in topographical sensory maps may transmit similar information to the next higher level of processing. How information transmission by groups of nearby neurons compares with the performance of single cells is a very important question for understanding the functioning of the nervous system. To tackle this problem, we quantified stimulus-encoding and feature extraction performance by pairs of simultaneously recorded electrosensory pyramidal cells in the hindbrain of weakly electric fish. These cells constitute the output neurons of the first central nervous stage of electrosensory processing. Using random amplitude modulations (RAMs) of a mimic of the fish's own electric field within behaviorally relevant frequency bands, we found that pyramidal cells with overlapping receptive fields exhibit strong stimulus-induced correlations. To quantify the encoding of the RAM time course, we estimated the stimuli from simultaneously recorded spike trains and found significant improvements over single spike trains. The quality of stimulus reconstruction, however, was still inferior to the one measured for single primary sensory afferents. In an analysis of feature extraction, we found that spikes of pyramidal cell pairs coinciding within a time window of a few milliseconds performed significantly better at detecting upstrokes and downstrokes of the stimulus compared with isolated spikes and even spike bursts of single cells. Coincident spikes can thus be considered "distributed bursts." Our results suggest that stimulus encoding by primary sensory afferents is transformed into feature extraction at the next processing stage. There, stimulus-induced coincident activity can improve the extraction of behaviorally relevant features from the stimulus.
Figures
Similar articles
-
Feature extraction by burst-like spike patterns in multiple sensory maps.J Neurosci. 1998 Mar 15;18(6):2283-300. doi: 10.1523/JNEUROSCI.18-06-02283.1998. J Neurosci. 1998. PMID: 9482813 Free PMC article. Review.
-
From stimulus encoding to feature extraction in weakly electric fish.Nature. 1996 Dec 12;384(6609):564-7. doi: 10.1038/384564a0. Nature. 1996. PMID: 8955269
-
From stimulus estimation to combination sensitivity: encoding and processing of amplitude and timing information in parallel, convergent sensory pathways.J Comput Neurosci. 2008 Aug;25(1):1-24. doi: 10.1007/s10827-007-0062-6. Epub 2008 Jan 5. J Comput Neurosci. 2008. PMID: 18176850 Free PMC article.
-
Parallel processing of sensory input by bursts and isolated spikes.J Neurosci. 2004 May 5;24(18):4351-62. doi: 10.1523/JNEUROSCI.0459-04.2004. J Neurosci. 2004. PMID: 15128849 Free PMC article.
-
Phantoms in the brain: ambiguous representations of stimulus amplitude and timing in weakly electric fish.J Physiol Paris. 2008 Jul-Nov;102(4-6):209-22. doi: 10.1016/j.jphysparis.2008.10.010. Epub 2008 Nov 1. J Physiol Paris. 2008. PMID: 18984041 Free PMC article. Review.
Cited by
-
A dynamic dendritic refractory period regulates burst discharge in the electrosensory lobe of weakly electric fish.J Neurosci. 2003 Feb 15;23(4):1524-34. doi: 10.1523/JNEUROSCI.23-04-01524.2003. J Neurosci. 2003. PMID: 12598641 Free PMC article.
-
Neuromodulation of early electrosensory processing in gymnotiform weakly electric fish.J Exp Biol. 2013 Jul 1;216(Pt 13):2442-50. doi: 10.1242/jeb.082370. J Exp Biol. 2013. PMID: 23761469 Free PMC article. Review.
-
Ionic and neuromodulatory regulation of burst discharge controls frequency tuning.J Physiol Paris. 2008 Jul-Nov;102(4-6):195-208. doi: 10.1016/j.jphysparis.2008.10.019. Epub 2008 Oct 18. J Physiol Paris. 2008. PMID: 18992813 Free PMC article. Review.
-
Nonlinear information processing in a model sensory system.J Neurophysiol. 2006 May;95(5):2933-46. doi: 10.1152/jn.01296.2005. Epub 2006 Feb 22. J Neurophysiol. 2006. PMID: 16495358 Free PMC article.
-
Innate recognition of pheromone and food odors in moths: a common mechanism in the antennal lobe?Front Behav Neurosci. 2010 Sep 24;4:159. doi: 10.3389/fnbeh.2010.00159. eCollection 2010. Front Behav Neurosci. 2010. PMID: 20953251 Free PMC article.
References
-
- Alonso JM, Usrey WM, Reid RC. Precisely correlated firing in cells of the lateral geniculate nucleus. Nature. 1996;383:815–819. - PubMed
-
- Bastian J. Electrolocation. I. How the electroreceptors of Apteronotus albifrons code for moving objects and other electrical stimuli. J Comp Physiol [A] 1981a;144:465–479.
-
- Bastian J. Electrolocation. II. The effects of moving objects and other electrical stimuli on the activities of two categories of posterior lateral line lobe cells in Apteronotus albifrons. J Comp Physiol [A] 1981b;144:481–494.
-
- Bastian J, Courtright J. Morphological correlates of pyramidal cell adaptation rate in the electrosensory lateral line lobe of weakly electric fish. J Comp Physiol [A] 1991;168:393–407. - PubMed
Publication types
MeSH terms
LinkOut - more resources
Full Text Sources