. 2002 Mar-Apr;4(2):112-20.
doi: 10.1038/sj.neo.7900210.

Development of PIN and prostate adenocarcinoma cell lines: a model system for multistage tumor progression

Affiliations

Development of PIN and prostate adenocarcinoma cell lines: a model system for multistage tumor progression

Colin R Soares et al. Neoplasia. 2002 Mar-Apr.

Abstract

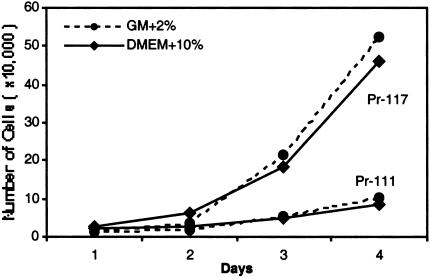
Existing prostate cancer cell lines have been derived from late stages of human prostate cancer. In this paper, we present two cell lines generated from prostatic intraepithelial neoplasia (PIN), the precursor lesion for prostate adenocarcinoma. Pr-111 and Pr-117 were established from PIN lesions that developed in the C3(1)/Tag transgenic model of prostate cancer. Pr-111 and Pr-117 cells express simian virus 40 large T antigen (SV40 Tag) and are immortalized in culture, distinguishing them from normal prostate cells. The growth rates of these two cell lines are quite different; with Pr-111 cells growing much more slowly (doubling time approximately 40 hours) compared to Pr-117 cells (doubling time approximately 22 hours), and also show significantly different growth rates in different media. Both prostate cell lines express cytokeratin and androgen receptor (AR) with Pr-111 cells demonstrating androgen-dependent growth and Pr-117 cells exhibiting androgen-responsive growth characteristics. Athymic nude mice injected with Pr-111 cells either do not develop tumors or develop tumors after a long latency period of 14 weeks. Pr-117 cells, however, develop tumors by 3 to 6 weeks, suggesting that Pr-117 cells represent a later stage of tumor progression. These two novel cell lines will be useful for studying early stages of prostate tumor development and androgen responsiveness.


Figures

Figure 1
Figure 1
Histology of C3(1)/Tag transgenic mouse prostates and growth of cell lines in culture on collagen. H&E sections of prostates from 3- and 5 1/2-month-old male transgenic mice show consecutively, (A) low-grade PIN demonstrating irregular spacing and cell crowding (arrow) and (B) high-grade PIN with some basal cell layer disruption and cell stratification (arrows) (light, x 100). Subsequent culture of isolated cells on collagen in GM+2% FBS resulted in two cell lines: (C) Pr-111 (passage 9) cell line from the low-grade PIN lesion and (D) Pr-117 (passage 9) cell line from the high-grade PIN lesion (phase contrast, x 200).
Figure 2
Figure 2
Cytokeratin and SV40 Tag expression in Pr-111 and Pr-117 cells using immunofluorescence. Cells (1x10⁵ cells/well) were grown on eight-well chamber slides and exposed to antibodies for pan-cytokeratin (antibody that detects a range of cytokeratins) and SV40 Tag. Pr-111 and Pr-117 cells show expression of cytokeratin and the SV40 Tag transgene. The epithelial A549 cell line (human lung carcinoma) represents a positive control for cytokeratin; NIH3T3 (mouse fibroblast cell line) is a negative control for cytokeratin; Pr-142 (mouse prostate adenocarcinoma cell line) is the positive control for SV40 Tag (fluorescent, x 400).
Figure 3
Figure 3
Protein expression analysis of transgenic mouse prostate cell lines. Western blot analysis shows that the Pr-111 and Pr-117 cell lines express SV40 Tag (A), and do not express the stromal cell marker, vimentin (B). (C) A matched gel was stained with coomassie blue for loading efficiency. Pr-142 is used as the negative control for vimentin and positive control for SV40 Tag, whereas NIH3T3 is used as the positive control for vimentin and negative control for SV40 Tag.
Figure 4
Figure 4
Growth curve for Pr-111 and Pr-117 cell lines. Twenty-four-well dishes coated with collagen were seeded with 5x10³ cells/well in GM+2% or DMEM+ 10%. Cells were trypsinized and counted with a hemocytometer every 24 hours. Pr-111 cells have a significantly slower growth rate compared to Pr-117 cells in both media. Each point represents an average of six wells in three independent experiments.
Figure 5
Figure 5
Morphological characteristics of Pr-111 and Pr-117 cells grown on plastic and Matrigel. Cells (5x10³) were plated on 30-mm2 plastic tissue culture dishes with and without 400 µl of the ECM, Matrigel. Both Pr-111 (A) and Pr-117 (B) cells exhibit cobblestone morphology when grown on plastic (phase contrast, x200). (A) Pr-111 demonstrates glandular-type growth characteristics on Matrigel in both GM+2% and DMEM+10%; (B) Pr-117 cells show ductal growth on Matrigel in GM+2% and glandular growth in DMEM+10% (varel, x200).
Figure 6
Figure 6
AR expression of Pr-111 and Pr-117 cell lines by RT-PCR. Total RNA was reverse transcribed into cDNA and amplified using specific mouse primers for AR. Both Pr-111 and Pr-117 cell lines express high levels of AR. Ur-12 (mouse urethral tumor cell line) does not exhibit AR expression by RTPCR (unpublished data). GAPDH was used as the internal control. The PCR products were separated on a 1% agarose gel and stained with ethidium bromide.
Figure 7
Figure 7
Androgen regulation in Pr-111 and Pr-117 cells. Ninety-six-well plates were plated with 1x10³ cells/well under various media conditions. Cells were quantified by an MTT assay every 4 days for cell growth. (A) Pr-111 cells show a significant response to androgen depletion (GM+2% CS-FBS and DMEM+10% CS-FBS) when compared to control conditions (GM+2% and DMEM+10%). (B) Pr-117 cells show androgen-independent growth in the GM+2% CS-FBS but not in the DMEM+10% CS-FBS. (C) When androgens are added back to the cells in DMEM+10% CS-FBS on day 22, Pr-117 cells resume replicating and Pr-111 cells did not. This is a representative of repeated experiments each showing similar results.
Figure 8
Figure 8
Histological analysis of tumors from nude mice studies. (A) H&E staining of a small growth (1.0 cm3 at 23 weeks) resulting from Pr-111 cells injected s.c. into nude mice. Cells exhibit variation in size of the nucleus, as well as sporadically stained chromatin (arrows). (B) Darkly stained cells demonstrating increased chromatin content (arrows) of a tumor (11.6 cm3 at 8 weeks) that developed at the injection site with Pr-117 cells (light, x400).

Similar articles

Cited by

References

    1. American Cancer Society, author. Cancer Facts and Figures 2001. Atlanta, GA: American Cancer Society; pp. 18–19.
    1. Bostwick DG. Progression of prostatic intraepithelial neoplasia to early invasive adenocarcinoma. Eur Urol. 1996;30:145–152. - PubMed
    1. Bostwick DG. High grade prostatic intraepithelial neoplasia: the most likely precursor of prostate cancer. Cancer. 1995;75:1823–1836.
    1. Bostwick DG, Pacelli A, Lopez-Beltran A. Molecular biology of prostatic intraepithelial neoplasia. Prostate. 1996;29:117–134. - PubMed
    1. Bostwick DG, Brawer MK. Prostatic intra-epithelial neoplasia and early invasion in prostate cancer. Cancer. 1987;59:788–794. - PubMed

Publication types

MeSH terms