

Transcriptional analyses of Barrett's metaplasia and normal upper GI mucosae
- PMID: 11896567
- PMCID: PMC1550324
- DOI: 10.1038/sj.neo.7900221
Transcriptional analyses of Barrett's metaplasia and normal upper GI mucosae
Abstract
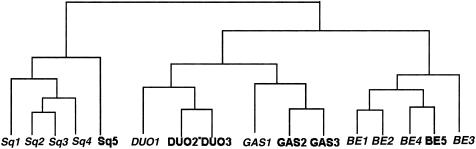
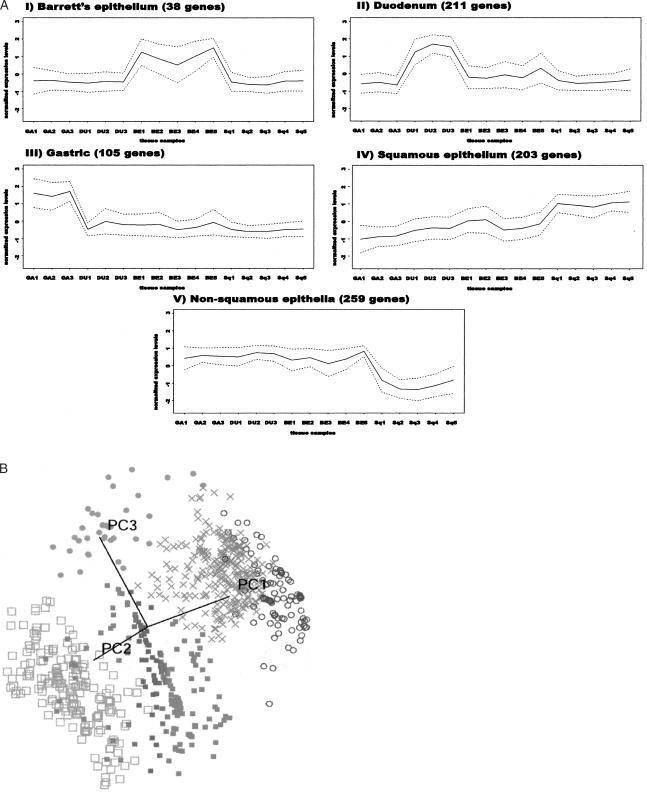
Over the last two decades, the incidence of esophageal adenocarcinoma (EA) has increased dramatically in the US and Western Europe. It has been shown that EAs evolve from premalignant Barrett's esophagus (BE) tissue by a process of clonal expansion and evolution. However, the molecular phenotype of the premalignant metaplasia, and its relationship to those of the normal upper gastrointestinal (GI) mucosae, including gastric, duodenal, and squamous epithelium of the esophagus, has not been systematically characterized. Therefore, we used oligonucleotide-based microarrays to characterize gene expression profiles in each of these tissues. The similarity of BE to each of the normal tissues was compared using a series of computational approaches. Our analyses included esophageal squamous epithelium, which is present at the same anatomic site and exposed to similar conditions as Barrett's epithelium, duodenum that shares morphologic similarity to Barrett's epithelium, and adjacent gastric epithelium. There was a clear distinction among the expression profiles of gastric, duodenal, and squamous epithelium whereas the BE profiles showed considerable overlap with normal tissues. Furthermore, we identified clusters of genes that are specific to each of the tissues, to the Barrett's metaplastic epithelia, and a cluster of genes that was distinct between squamous and non-squamous epithelia.
Figures
References
-
- Levine DS, et al. Specialized metaplastic columnar epithelium in Barrett's esophagus. A comparative transmission electron microscopic study. Lab Invest. 1989;60(3):418–432. - PubMed
-
- Levine DS, et al. Correlation of ultrastructural aberrations with dysplasia and flow cytometric abnormalities in Barrett's epithelium. Gastroenterology. 1989;96(2 Pt. 1):355–367. - PubMed
-
- Moore JH, et al. Intestinal differentiation and p53 gene alterations in Barrett's esophagus and esophageal adenocarcinoma. Int J Cancer. 1994;56(4):487–493. - PubMed
-
- Regalado SP, et al. Abundant expression of the intestinal protein villin in Barrett's metaplasia and esophageal adenocarcinomas. Mol Carcinogen. 1998;22(3):182–189. - PubMed
-
- Wu GD, et al. Sucrase-isomaltase gene expression in Barrett's esophagus and adenocarcinoma. Gastroenterology. 1993;105(3):837–844. - PubMed
MeSH terms
Substances
LinkOut - more resources
Full Text Sources
Other Literature Sources
Medical