Comparative Study
. 2002 Mar-Apr;4(2):151-63.
doi: 10.1038/sj.neo.7900201.

Deregulated expression of the human tumor marker CEA and CEA family member CEACAM6 disrupts tissue architecture and blocks colonocyte differentiation

Affiliations
Comparative Study

Deregulated expression of the human tumor marker CEA and CEA family member CEACAM6 disrupts tissue architecture and blocks colonocyte differentiation

Christian Ilantzis et al. Neoplasia. 2002 Mar-Apr.

Abstract

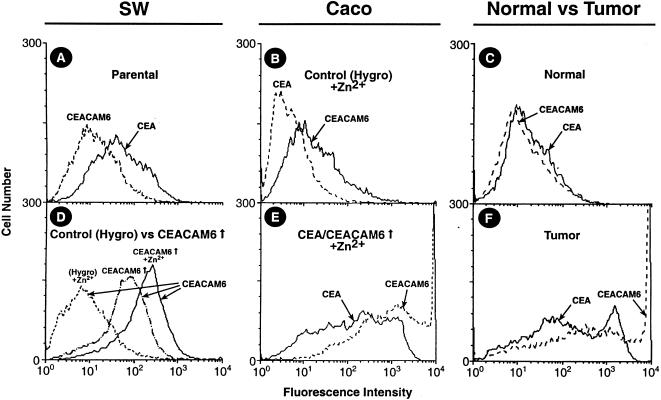
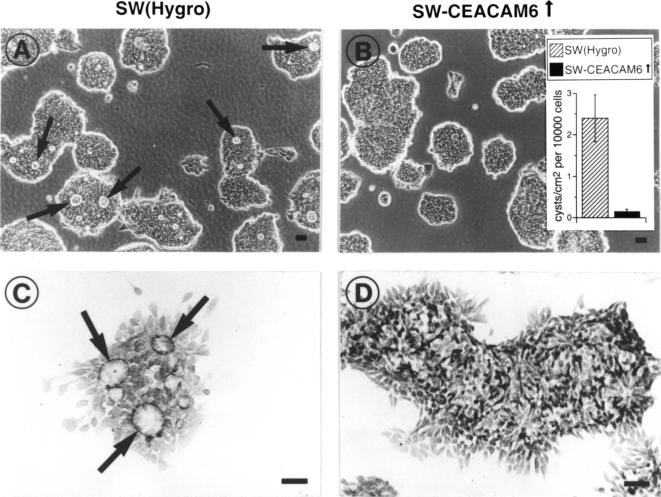
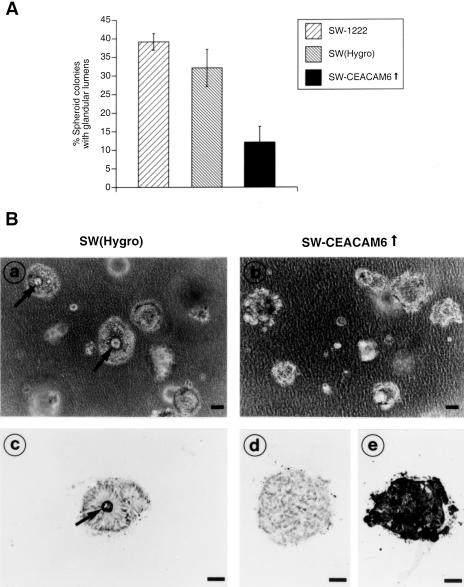
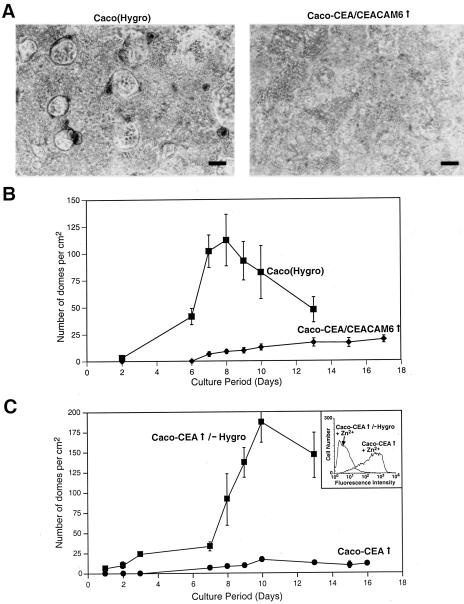
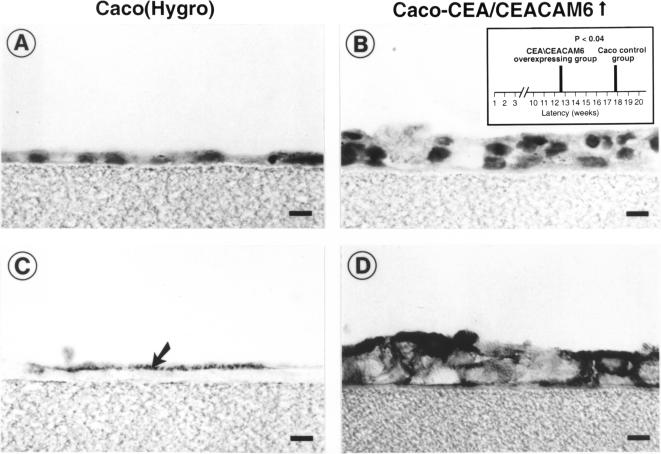
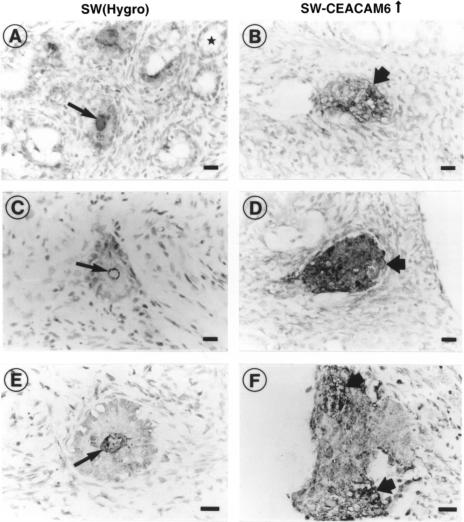
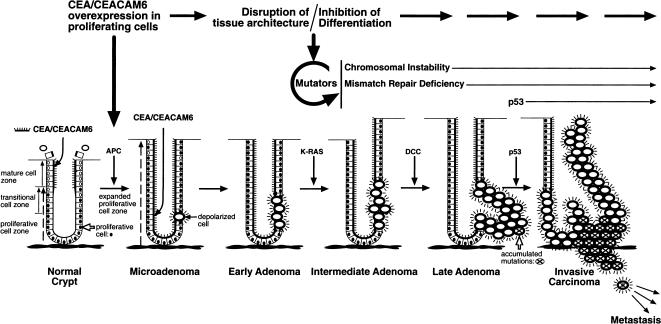
Human carcinoembryonic antigen (CEA) and the CEA family member CEACAM6 (formerly nonspecific cross-reacting antigen [NCA]) function in vitro, at least, as homotypic intercellular adhesion molecules and, in model systems, can block the terminal differentiation and anoikis of several different cell types. We have recently demonstrated that the increased cell surface levels of CEA and CEACAM6 in purified human colonocytes from freshly excised, well to poorly differentiated colon carcinomas are inversely correlated with the degree of cellular differentiation. Thus, deregulated expression of CEA/CEACAM6 could directly contribute to colon tumorigenesis by the inhibition of terminal differentiation and anoikis. Evidence against this view includes the common observation of increased CEA/CEACAM6 expression as normal colonocytes differentiate in their migration up colonic crypt walls. We report here the direct effects of deregulated overexpression of CEA/CEACAM6, at levels observed in colorectal carcinomas, on the differentiation of two human colonic cell lines, SW-1222 and Caco-2. Stable transfectants of both of these cell lines that constitutively express 10- to 30-fold higher cell surface levels of CEA/CEACAM6 than endogenous levels failed to polarize and differentiate into glandular structures in monolayer or 3D culture or to form colonic crypts in a tissue architecture assay in nude mice. In addition, these transfectants were found to exhibit increased tumorigenicity in nude mice. These results thus support the contention that deregulated overexpression of CEA and CEACAM6 could provide a tumorigenic contribution to colon carcinogenesis.


Figures

Figure 1
Figure 1
FACS profiles indicating levels of cell surface expression of CEA and CEACAM6 in parental SW-1222 cells, in transfected SW-1222 and Caco-2 cell populations, and in purified epithelial single-cell suspensions prepared from a freshly resected colonic tumor sample and adjacent normal crypts [7]. (A) Levels of CEA and CEACAM6 in parental (untransfected) SW-1222 cells. (B) Levels of CEA and CEACAM6 in control Caco (Hygro) cells transfected with vector alone in the presence of Zn2+. (C) Cell surface expression of CEA and CEACAM6 in purified epithelial cells prepared from normal colonic crypts [7]. (D) CEACAM6 overexpression in uninduced (four-fold increase in mean level) and Zn2+-induced (nine-fold increase in mean level) SW-CEACAM6↑ relative to endogenous control levels in Zn2+-treated control SW(Hygro) cells transfected with vector alone. (E) Zn2+-induced levels of CEA and CEACAM6 in Caco-CEA/CEACAM6↑ cells. (F) Cell surface expression of CEA and CEACAM6 in purified epithelial cells prepared from tumor colonic crypts [7]. The tumor profiles show levels of both CEA and CEACAM6 that greatly exceed levels in adjacent normal crypts.
Figure 2
Figure 2
Intercellular cysts in control (A) and (C) versus SW-CEACAM6↑ cells (B) and (D) in monolayer culture at late stationary phase. (A) Live phase contrast appearance of control SW(Hygro) cells showing the formation of numerous intercellular cysts (arrows). (B) Phase contrast appearance of live SW-CEACAM6↑ cells at late stationary phase demonstrating a lack of appreciable intercellular cysts; (inset) quantitation of cysts per square centimeter per 105 cells. Values shown are the mean of three experiments comparing SW(Hygro) and SW-CEACAM6↑ cells; error bars, SD. (C) Immunolocalization of villin to the apical membrane domain (arrows) of cells lining intercellular cysts in monolayer culture of control SW(Hygro) cells counterstained with hematoxylin. (D) Delocalized immunohistochemical demonstration of villin in monolayer culture of SW-CEACAM6↑ cells counterstained with hematoxylin. Bars: 10 µm.
Figure 3
Figure 3
Glandular differentiation of SW-1222 cells and transfected populations grown in 3D collagen gels. (A) Quantitation of glandular differentiation as assessed by the percentage of spheroid colonies with identifiable central gland-like lumens. Values shown represent the mean of three experiments; error bars, SD. (B) Comparison of control SW(Hygro) (a and c) and SW-CEACAM6↑ spheroid colonies (b, d, and e): (a) Phase contrast appearance of live unsectioned SW(Hygro) spheroid colonies in collagen gel. Cells are organized around a central lumen indicating glandular differentiation (arrows). (b) Phase contrast appearance of live unsectioned SW-CEACAM6↑ spheroid colonies in collagen gel. SW-CEACAM6↑ cells show a more irregular and undifferentiated pattern of growth. (c) Immunostained section of well-differentiated SW(Hygro) spheroid showing well-oriented nuclei polarized to the periphery and endogenous CEACAM6 expression localized to the apical pole (arrow) at the cellular level (counterstained with hematoxylin). (d) Hematoxylin-stained section of a poorly differentiated SW-CEACAM6↑ spheroid colony showing disorganized growth. (e) Immunostained section of a poorly differentiated SW-CEACAM6↑ spheroid colony showing intense staining of delocalized CEACAM6 (counterstained with hematoxylin). Bars: 12 µm.
Figure 4
Figure 4
Dome formation of control Caco (Hygro) cells versus Caco-2 CEA/CEACAM6 transfectants in monolayer culture. (A, left) Phase contrast micrograph showing numerous domes formed by postconfluent monolayer of control Caco (Hygro) cells. (A, right) Phase contrast micrograph of postconfluent Caco-CEA/CEACAM6↑ cells showing dramatic reduction in dome formation. Bars: 60 µm. (B) Kinetics of dome formation for Caco (Hygro) versus Caco-CEA/CEACAM6↑ cells. Values shown represent the mean of three experiments; error bars, SD. (C) Kinetics of dome formation for Caco-CEA↑ versus Caco-CEA↑ cells that have completely lost CEA overexpression (Caco-CEA↑/-Hygro). Values shown represent the mean of two experiments; error bars, SD. Relative cell surface levels of CEA (inset) are indicated.
Figure 5
Figure 5
Comparison of postconfluent control Caco (Hygro) (A and C) and Caco-CEA/CEACAM6↑ cells (B and D) grown on collagen-coated filters (Millicell-CM, Millipore) sectioned perpendicular to the plane of support. (A) Section of control cells stained with hematoxylin showing a single layer of Caco (Hygro) cells in contact with the underlying filter support directly beneath. (B) Section of hematoxylin stained Caco-CEA/CEACAM6↑ cells revealing multilayering. (C) Immunohistochemical demonstration of CEA localized to the upper monolayer surface (arrow) of Caco (Hygro) control cells indicating cellular polarization. (D) Intense delocalized expression of CEA in immunostained section of CEA/CEACAM6↑ cells showing high levels of CEA over the entire surface of cells, in adjacent areas between cells, and on membrane surfaces in contact with the underlying support, consistent with a lack of cellular polarization. Bars: 8 µm.
Figure 6
Figure 6
Comparison of architecture adopted by control SW(Hygro) and SW-CEACAM6↑ test cells detected by CEA immunoreactivity using tissue architecture assay. (A, C, and E) Photomicrographs of immunostained sections of in vivo grown SW(Hygro)/FRCC control mixed aggregates showing well-organized SW(Hygro) crypt-like structures with polarized staining of CEA (arrows) localized to the apical pole of cells facing the crypt lumen. Nuclei well-oriented to the basal pole of CEA positive cells can be seen. Note the presence of CEA-negative crypt structures in (A) derived from FRCC (star). (B, D, and F) Photomicrographs of immunostained sections of in vivo grown SW-CEACAM6↑/FRCC mixed aggregates showing poorly organized and highly dysplastic foci of SW-CEACAM6↑ cells (thick arrows) with delocalized staining of CEA. Micrographs are representative of serial sections obtained from three separate independent experiments. Bars: 10 µm.
Figure 7
Figure 7
Model for oncogenic effect of deregulated overexpression of CEA/CEACAM6↑ in colonic epithelial crypt cells with proliferative potential.

Similar articles

Cited by

References

    1. Kinzler KW, Vogelstein B. Lessons from hereditary colorectal cancer. Cell. 1996;87:159–170. - PubMed
    1. Boucher D, Cournoyer D, Stanners CP, Fuks A. Studies on the control of gene expression of the carcinoembryonic antigen family in human tissue. Cancer Res. 1989;49:847–852. - PubMed
    1. Zimmer R, Thomas P. Mutations in the carcinoembryonic antigen gene in colorectal cancer patients: implications on liver metastasis. Cancer Res. 2001;61:2822–2826. - PubMed
    1. Chevinsky AH. CEA in tumors of other than colorectal origin. Semin Surg Oncol. 1991;7:162–166. - PubMed
    1. Öbrink B. CEA adhesion molecules: multifunctional proteins with signal-regulatory properties. Curr Opin Cell Biol. 1997;9:616–626. - PMC - PubMed

Publication types

MeSH terms

LinkOut - more resources