. 2002 Feb 27:2:1.
doi: 10.1186/1471-2318-2-1.

Frailty, fitness and late-life mortality in relation to chronological and biological age

Affiliations

Frailty, fitness and late-life mortality in relation to chronological and biological age

Arnold B Mitnitski et al. BMC Geriatr. .

Abstract

Background: People age at remarkably different rates, but how to estimate trajectories of senescence is controversial.

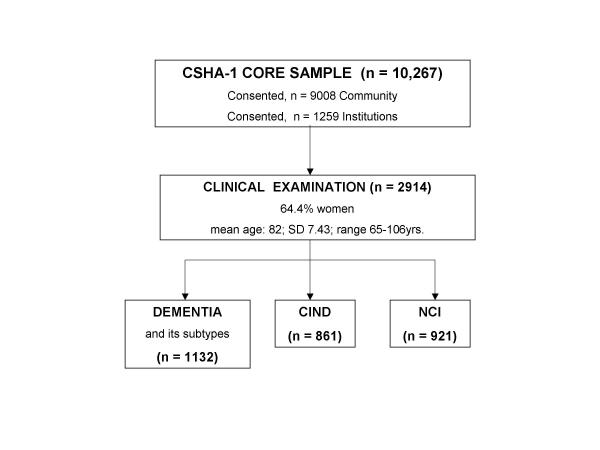
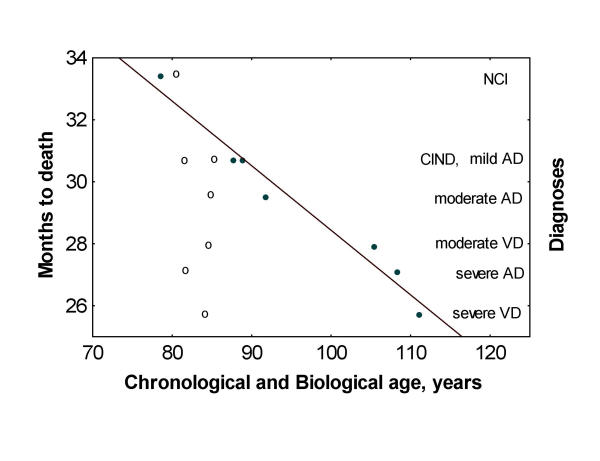
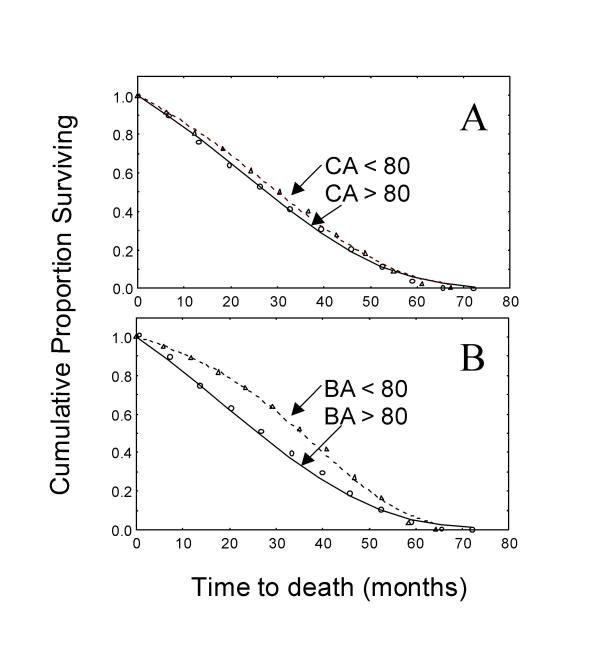
Methods: In a secondary analysis of a representative cohort of Canadians aged 65 and over (n = 2914) we estimated a frailty index based on the proportion of 20 deficits observed in a structured clinical examination. The construct validity of the index was examined through its relationship to chronological age (CA). The criterion validity was examined in its ability to predict mortality, and in relation to other predictions about aging. From the frailty index, relative (to CA) fitness and frailty were estimated, as was an individual's biological age.

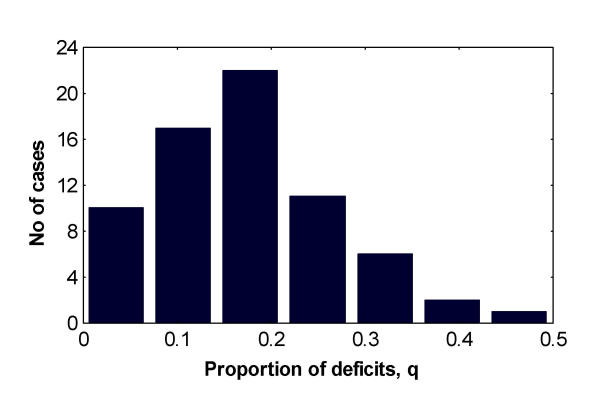
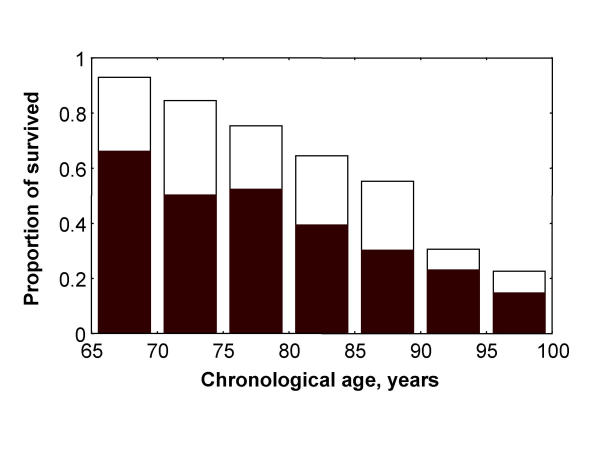
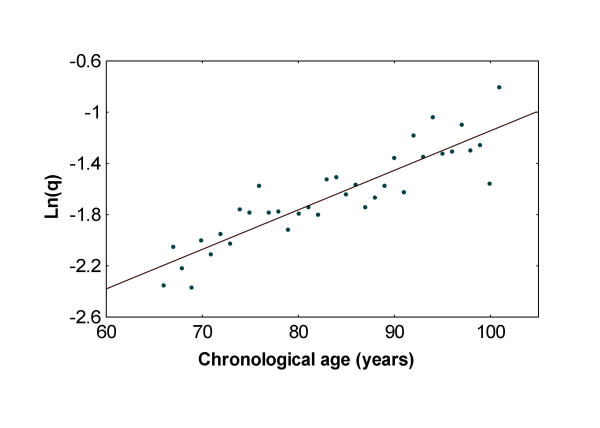
Results: The average value of the frailty index increased with age in a log-linear relationship (r = 0.91; p < 0.001). In a Cox regression analysis, biological age was significantly more highly associated with death than chronological age. The average increase in the frailty index (i.e. the average accumulation of deficits) amongst those with no cognitive impairment was 3 per cent per year.

Conclusions: The frailty index is a sensitive predictor of survival. As the index includes items not traditionally related to adverse health outcomes, the finding is compatible with a view of frailty as the failure to integrate the complex responses required to maintain function.


Figures

Figure 1
Figure 1
Population sample flow chart.
Figure 2
Figure 2
The distribution of the frailty index at chronological age 77 suggests varying levels of fitness and frailty, even in those with no cognitive impairment.
Figure 3
Figure 3
The proportion of survivals for frail (solid rectangles) and fit individuals (total rectangles) decreases with the chronological age. However, frail individuals show lower survival at all age groups than do fit individuals.
Figure 4
Figure 4
Mean proportion of deficits at any given age for subjects with no cognitive impairment. Solid circles represent the proportion of the deficits averaged across all subjects at age CA: In (q) = - 4.23 + 0.03 CA. Correlation coefficient, r = 0.91, p < 0.0001
Figure 5
Figure 5
Time to death by cognitive diagnostic groups as a function of chronological and biological age. Solid circles correspond to average values of time to death (across all subjects of the particular diagnostic group) with respect to averaged BA distributed along a straight line (r = - 0.98, p < 0.001). Empty circles, (o) correspond to time to death with respect to CA and did not show such a pattern. The following abbreviations are used for the diagnostic groups: NCI (No Cognitive Impairment), CIND (Cognitive Impairment No Dementia), AD (Alzheimer's disease), VD (vascular dementia).
Figure 6
Figure 6
Cumulative proportion of surviving as a function of time to death for two groups with chronological age (A) and biological age (B) less and greater than 80 years. Circles correspond to experimental data for individuals below 80 years old and triangles for individuals above 80 years. Curves correspond to the least square Gompertz's functions (solid lines fit data for the individuals below 80 years and dashed lines for those who was older than 80 years).
Figure 7
Figure 7
Inter signs synergy graph. Nodes indicate the deficits (codes correspond to the deficits from Methods and [29]) and edges indicate the statistically significant relationships between deficits, i.e. when the conditional probability of one deficit, given another is statistically different (p < 0.05; t-test) from the unconditional probability of the first deficit.

References

    1. Rockwood K, Fox RA, Stolee P, Robertson D, Beattie BL. Frailty in elderly people; an evolving concept. CMAJ. 1994;150:489–495. - PMC - PubMed
    1. Reisberg B, Ferris SH, de-Leon MJ, Crook T. The Global Deterioration Scale for assessment of primary degenerative dementia. Am J of Psych. 1982;139:1136–1139. - PubMed
    1. Hébert R, Brayne C, Spiegelhalter D. Factors associated with functional decline and improvement in a very elderly community-dwelling population. AMJE. 1999;150:501–510. - PubMed
    1. Thomas VS, Rockwood K, McDowell I. Multidimensionality in instrumental and basic activities of daily living. J Clin Epidemiol. 1997;51:315–321. doi: 10.1016/S0895-4356(97)00292-8. - DOI - PubMed
    1. Seeman TE, Berkman LF, Charpentier PA, Blazer DG, Albert MS, Tinetti ME. Behavioural and psychosocial predictors of physical performance: MacArthur studies of successful aging. J Gerontol A Biol Sci Med Sci. 1995;50:M177–M183. - PubMed