. 2002 Mar 15;539(Pt 3):869-82.
doi: 10.1113/jphysiol.2001.013095.

Differential effects of sarcoplasmic reticular Ca(2+)-ATPase inhibition on charge movements and calcium transients in intact amphibian skeletal muscle fibres

Affiliations

Differential effects of sarcoplasmic reticular Ca(2+)-ATPase inhibition on charge movements and calcium transients in intact amphibian skeletal muscle fibres

Sangeeta Chawla et al. J Physiol. .

Abstract

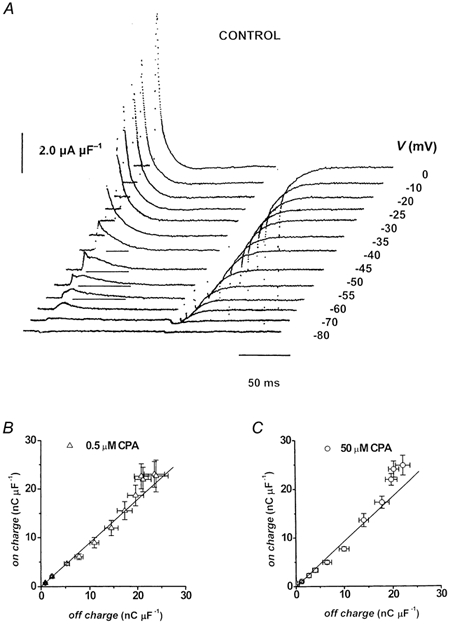
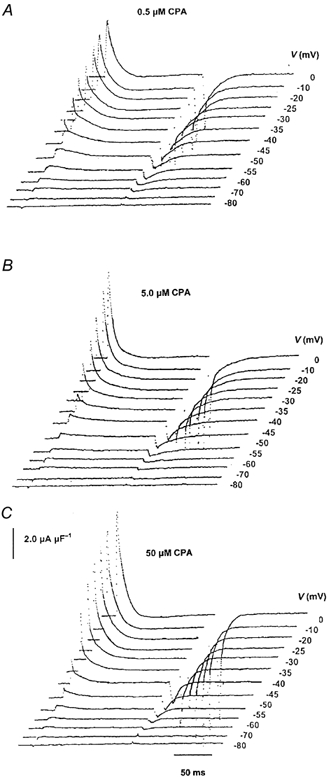
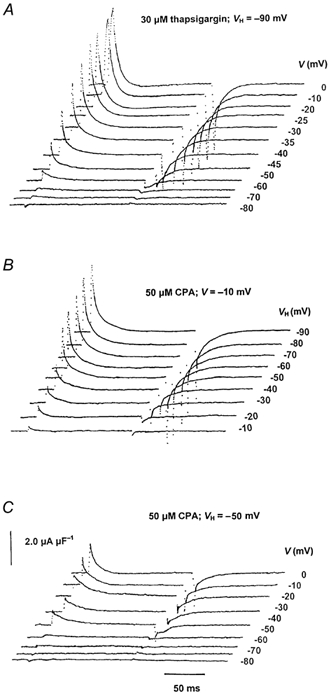
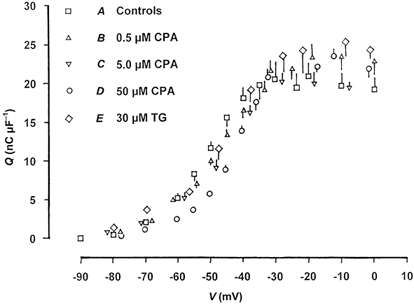
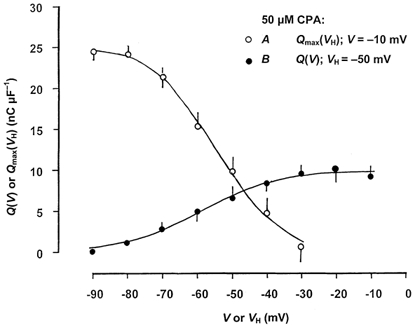
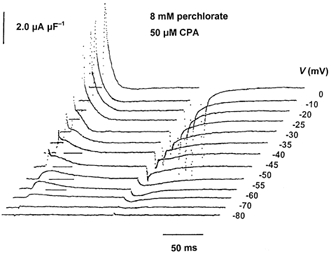
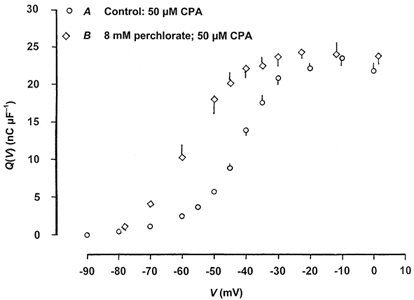
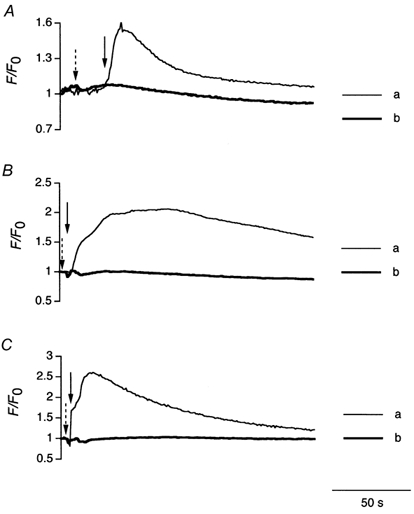
A hypothesis in which intramembrane charge reflects a voltage sensing process allosterically coupled to transitions in ryanodine receptor (RyR)-Ca(2+) release channels as opposed to one driven by release of intracellularly stored Ca(2+) would predict that such charging phenomena should persist in skeletal muscle fibres unable to release stored Ca(2+). Charge movement components were accordingly investigated in intact voltage-clamped amphibian fibres treated with known sarcoplasmic reticular (SR) Ca(2+)-ATPase inhibitors. Cyclopiazonic acid (CPA) pretreatment abolished Ca(2+) transients in fluo-3-loaded fibres following even prolonged applications of caffeine (10 mM) or K(+) (122 mM). Both CPA and thapsigargin (TG) transformed charge movements that included delayed (q(gamma)) "hump" components into simpler decays. However, steady-state charge-voltage characteristics were conserved to values (maximum charge, Q(max) approximately equal to 20-25 nC microF(-1); transition voltage, V* approximately equal to -40 to-50 mV; steepness factor, k approximately equal to 6-9 mV; holding voltage -90 mV) indicating persistent q(gamma) charge. The features of charge inactivation similarly suggested persistent q(beta) and q(gamma) charge contributions in CPA-treated fibres. Perchlorate (8.0 mM) restored the delayed kinetics shown by "on" q(gamma) charge movements, prolonged their "off" decays, conserved both Q(max) and k, yet failed to restore the capacity of such CPA-treated fibres for Ca(2+) release. Introduction of perchlorate (8.0 mM) or caffeine (0.2 mM) to tetracaine (2.0 mM)-treated fibres, also known to restore q(gamma) charge, similarly failed to restore Ca(2+) transients. Steady-state intramembrane q(gamma) charge thus persists with modified kinetics that can be restored to its normally complex waveform by perchlorate, even in intact muscle fibres unable to release Ca(2+). It is thus unlikely that q(gamma) charge movement is a consequence of SR Ca(2+) release rather than changes in tubular membrane potential.


Figures

Figure 1
Figure 1. Charge movements in control fibres and comparisons between ‘on’ and ‘off’ charge following treatment with CPA
A, typical charge movements obtained from a control fibre studied in the absence of Ca2+-ATPase inhibitors showing delayed (qγ) charging phases as reported on earlier occasions. Fibre a89. Temperature = 2.7 °C, Ri = 427.3 Ω cm. Cable constants: λ = 2.16 mm, ri = 7904.3 kΩ cm−1, d = 83.0 μm, rm = 367.8 kΩ cm, Rm = 9.59 kΩ cm2, Cm = 6.5 μF cm−2. B and C, plots of ‘on’ against ‘off’ intramembrane charge following the addition of 0.5 (B; 5 fibres) and 50 μm CPA (C; 6 fibres: see legend to Fig. 4 for details).
Figure 2
Figure 2. Treatment with cyclopiazonic acid (CPA) removes delayed charging phases normally identified with transitions in qγ charge
Typical charge movements obtained from voltage-clamped fibres studied in the presence of 0.5 (A) 5.0 (B) and 50 μm CPA (C). Voltage steps were made to a series of progressively depolarized test levels, V, from a fixed holding potential of −90 mV. Display was at high gain to emphasise contributions of smaller or delayed current components, which can just be discerned in (A) but not in (B) or (C). A, fibre a60 in 0.5 μm CPA. Temperature = 4.5 °C, Ri = 403.8 Ω cm. Cable constants: λ = 2.12 mm, ri = 8339.1 kΩ cm−1, d = 78.5 μm, rm = 374.09 kΩ cm, Rm = 9.23 kΩ cm2, Cm = 11.4 μF cm−2. B, fibre a61 in 5.0 μm CPA. Temperature = 5.0 °C, Ri = 397.5 Ω cm. Cable constants: λ = 1.81 mm, ri = 7862.2 kΩ cm−1, d = 80.2 μm, rm = 257.05 kΩ cm, Rm = 6.47 kΩ cm2, Cm = 8.9 μF cm−2. C, fibre z79 in 50 μm CPA. Temperature = 4.3 °C, Ri = 406 Ω cm. Cable constants: λ = 1.41 mm, ri = 8698 kΩ cm−1, d = 77.1 μm, rm = 172 kΩ cm, Rm = 4.17 kΩ cm2, Cm = 8.3 μF cm−2.
Figure 3
Figure 3. Charge movements following different manoeuvres to demonstrate steeply voltage-dependent charge movement in fibres exposed to Ca2+-ATPase inhibitors
A, charging transients from a fibre treated with the alternative Ca2+ pump blocker thapsigargin (30 μm) independently shows alterations to the charging transients similar to those following treatment with CPA (Fig. 2). B, charge movements following large voltage steps made from a prepulse level of −90 mV to a fixed test voltage of −10 mV in a CPA-treated fibre held at different holding potentials, VH. C, charge movements following test voltage steps made from a prepulse level of −90 mV to a range of test voltages, V, in a CPA-treated fibre following a shift in holding voltage from −90 to −50 mV. A, fibre a26 in thapsigargin. Temperature = 6.1 °C, Ri = 383.9 Ω cm. Cable constants: λ = 1.67 mm, ri = 5207.9 kΩ cm−1, d = 96.9 μm, rm = 144.75 kΩ cm, Rm = 4.41 kΩ cm2, Cm = 15.4 μF cm−2. Inactivation study (B): fibre a77 in 50 μm CPA. Temperature = 6.0 °C, Ri = 385.14 Ω cm. Cable constants: λ = 1.56 mm, ri = 8877.8 kΩ cm−1, d = 74.3 μm, rm = 214.8 kΩ cm, Rm = 5.02 kΩ cm2, Cm = 13.6 μF cm−2. Effect of fixed shift in holding voltage studied in fibre a52 (C). Temperature = 4.0 °C, Ri = 410.1 Ω cm. Cable constants: λ = 1.50 mm, ri = 10070 kΩ cm−1, d = 72.0 μm, rm = 227.69 kΩ cm, Rm = 5.15 kΩ cm2, Cm = 14.66 μF cm−2.
Figure 4
Figure 4. Conservation of steady-state charge-voltage properties in fibres exposed to Ca2+-ATPase inhibitors
Charge-voltage curves obtained in the presence of cyclopiazonic acid (CPA) at concentrations of 0.0 (A, □), 0.5 (B, ▵), 5.0 (C, ▿) and 50 μm (D, ○) and thapsigargin (TG) (30 μm: E, ⋄). Fibres at a −90 mV holding potential. Six fibres studied in 0.0 μm CPA (A): Temperature = 6.2 ± 0.1 °C, Ri = 383 ± 1.6 Ω cm. Cable constants: λ = 2.0 ± 0.15 mm, ri = 9111.0 ± 713.5 kΩ cm−1, d = 74.5 ± 3.1 μm, rm = 364.1 ± 39.9 kΩ cm, Rm = 8.5 ± 1.09 k Ω cm2, Cm = 6.3 ± 0.47 μF cm−2. Five fibres studied in 0.5 μm CPA (B). Temperature = 5.1 ± 0.17 °C, Ri = 395.9 ± 2.14 Ω cm. Cable constants: λ = 1.9 ± 0.18 mm, ri = 6565.5 ± 972.26 kΩ cm−1, d = 91.2 ± 7.90 μm, rm = 251.74 ± 51.84 kΩ cm, Rm = 6.79 ± 1.27 kΩ cm2, Cm = 14.5 ± 1.89 μF cm−2. Four fibres studied in 5.0 μm CPA (C). Temperature = 6.4 ± 0.09 °C, Ri = 379.4 ± 1.11 Ω cm. Cable constants: λ = 1.51 ± 0.23 mm, ri = 6473.25 ± 1492.9 kΩ cm−1, d = 92.9 ± 12.65 μm, rm = 156.39 ± 48.02 kΩ cm, Rm = 4.23 ± 1.29 kΩ cm2, Cm = 9.7 ± 2.51 μF cm−2. Six fibres studied in 50 μm CPA (D). Temperature = 4.75 ± 0.40 °C, Ri = 400.59 ± 5.01 Ω cm. Cable constants: λ = 1.77 ± 0.18 mm, ri = 9884.8 ± 1992.8 kΩ cm−1, d = 76.1 ± 6.01 μm, rm = 280.5 ± 27.98 kΩ cm, Rm = 6.73 ± 0.95 kΩ cm2, Cm = 7.7 ± 1.10 μF cm−2. Seven fibres studied in 30 μm TG (E). Temperature = 6.5 ± 0.02 °C, Ri = 379.6 ± 0.31 Ω cm. Cable constants: λ = 2.4 ± 0.23 mm, ri = 4818.94 ± 933.77 kΩ cm−1, d = 116.1 ± 6.17 μm, rm = 244.33 ± 45.31 kΩ cm, Rm = 8.04 ± 1.29 kΩ cm2, Cm = 19.7 ± 3.00 μF cm−2.
Figure 5
Figure 5. Inactivation properties shown by steady-state intramembrane charge in CPA-containing solutions
A, inactivation curves (mean ±s.e.m.; 7 fibres) obtained by determination of the intramembrane charge movement (Qmax(VH)) following voltage steps from −90 mV to −10 mV at different holding potentials, VH (○). Temperature = 5.6 ± 0.21 °C, Ri = 389.8 ± 2.61 Ω cm. Cable constants: λ = 1.50 ± 0.13 mm, ri = 9781.7 ± 1768.2 kΩ cm−1, d = 77.09 ± 7.45 μm, rm = 213.33 ± 34.91 kΩ cm, Rm = 4.87 ± 0.79 kΩ cm2, Cm = 14.1 ± 2.18 μF cm−2. B, the dependence of the steady-state charge (Q(V)) upon test voltage (mean ±s.e.m.; 4 fibres) studied at a holding potential (VH) shifted from −90 to −50 mV (•). Temperature = 5.1 ± 0.35 °C, Ri = 396.5 ± 4.53 Ω cm. Cable constants: λ = 1.60 ± 0.16 mm, ri = 10850.13 ± 1875.2 kΩ cm−1, d = 71.1 ± 5.59 μm, rm = 257.20 ± 14.88 kΩ cm, Rm = 5.76 ± 0.70 kΩ cm2, Cm = 13.1 ± 1.40 μF cm−2.
Figure 6
Figure 6. Effects of perchlorate on charging kinetics in CPA-treated fibres
Charge movements were elicited by depolarizing test steps that were varied from the −90 mV holding potential in CPA (50 μm)-treated muscle fibres in the presence of 8.0 mm perchlorate. Note the restoration of ‘on’‘hump’ currents characteristic of qγ charge that took place in the absence of any appreciable prior qβ decay at some membrane potentials and prolonged ‘off’ recovery tails. Fibre a13. Temperature = 6.0 °C, Ri = 385.1 Ω cm. Cable constants: λ = 2.59 mm, ri = 6287 kΩ cm−1, d = 88.31 μm, rm = 420.48 kΩ cm, Rm = 11.66 kΩ cm2, Cm = 10.6 μF cm−2.
Figure 7
Figure 7. The effects of perchlorate on steady-state features of the intramembrane charge in CPA-treated fibres
Charge-voltage curves in the absence (A, data points as in Fig. 4; ○) and the presence of perchlorate (8.0 mm) (B, ⋄) in CPA (50 μm)-treated fibres. Six fibres studied in the presence of both CPA and perchlorate (B). Temperature = 6.1 ± 0.23 °C, Ri = 383.56 ± 2.73 Ω cm. Cable constants: λ = 2.13 ± 0.17 mm, ri = 6562.77 ± 737 kΩ cm−1, d = 88.3 ± 5.02 μm, rm = 286.16 ± 30.12 kΩ cm, Rm = 7.96 ± 0.99 kΩ cm2, Cm = 10.0 ± 1.43 μF cm−2.
Figure 8
Figure 8. Effect of CPA on K+ and caffeine induced calcium transients
A, normalized fluo-3 fluorescence signals from a muscle fibre in response to 122 mm[K+] in control (a) and 50 μm CPA-pretreated (b) muscles. B, normalized fluo-3 signals in response to 10 mm caffeine in control (a) and 50 μm CPA-pretreated (b) muscle fibres. C, normalized fluo-3 fluorescence signals from muscle fibres stimulated with 122 mm[K+] in the presence of 8 mm perchlorate in control (a) or in CPA-pretreated fibres (b). Arrival of the stimulating solution is indicated in each case by a continuous vertical arrow in the control and a dashed vertical arrow in the CPA-pretreated muscle.

Similar articles

Cited by

References

    1. Adrian RH, Huang CL-H. Charge movements near the mechanical threshold in skeletal muscle of Rana temporaria. Journal of Physiology. 1984;349:483–500. - PMC - PubMed
    1. Adrian RH, Peres A. Charge movement and membrane capacity in frog muscle. Journal of Physiology. 1979;289:83–97. - PMC - PubMed
    1. Anderson K, Meissner G. T tubule depolarization-induced SR Ca2+ release is controlled by dihydropyridine receptor- and Ca2+-dependent mechanisms in cell homogenates from rabbit skeletal muscle. Journal of General Physiology. 1995;105:363–383. - PMC - PubMed
    1. Caputo C. Volume and twitch tension changes in single muscle fibres in hypertonic solutions. Journal of General Physiology. 1968;52:793–809. - PMC - PubMed
    1. Caputo C. The effect of caffeine and tetracaine on the time course of potassium contractures of single muscle fibres. Journal of Physiology. 1976;255:191–207. - PMC - PubMed

Publication types

MeSH terms

LinkOut - more resources