

Areas of the brain concerned with ventilatory load compensation in awake man
- PMID: 11897862
- PMCID: PMC2290189
- DOI: 10.1113/jphysiol.2001.012957
Areas of the brain concerned with ventilatory load compensation in awake man
Abstract
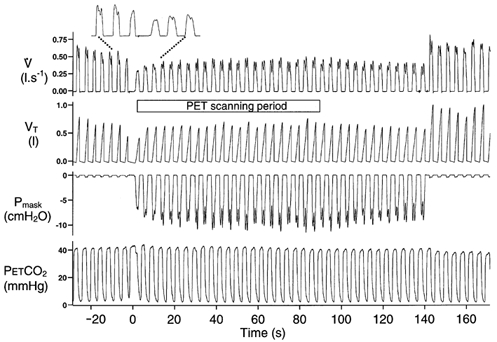
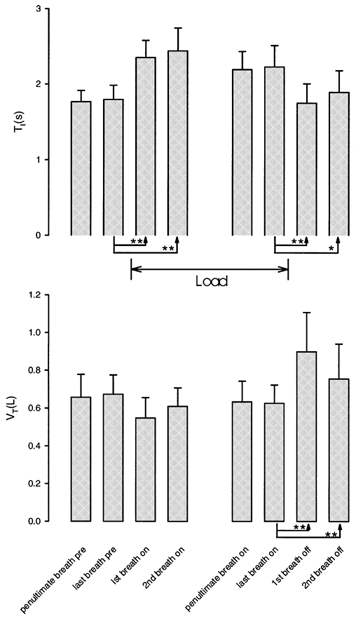
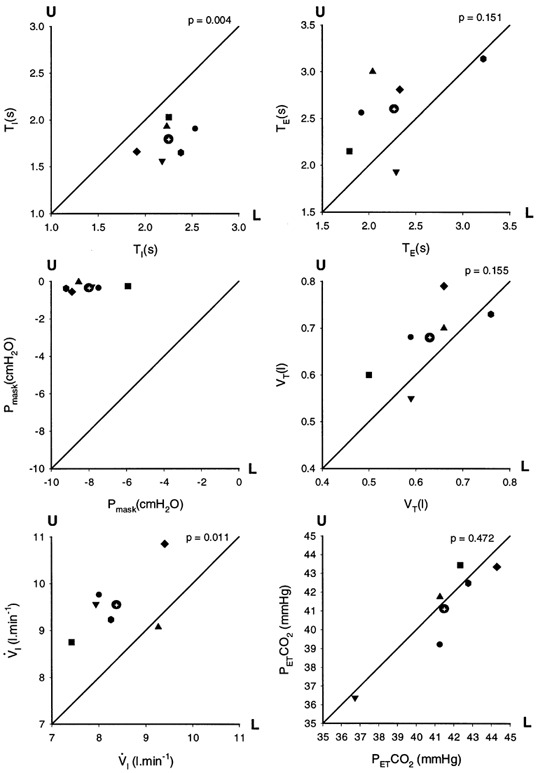
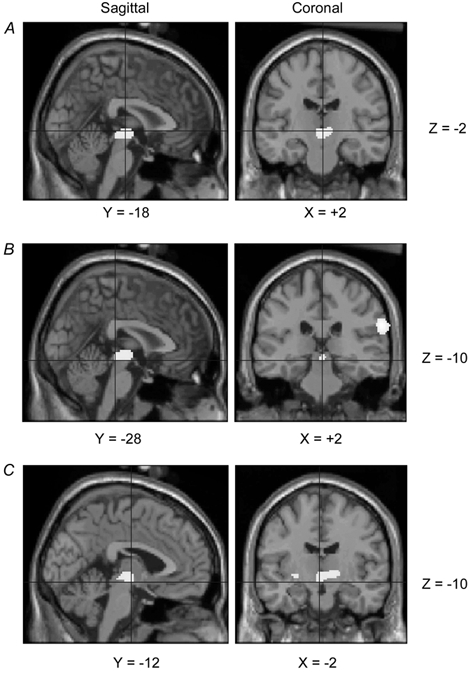
There is broad agreement that the awake human ventilatory response to a moderate inspiratory load consists of a prolongation of inspiratory time (T(I)) with a maintenance of tidal volume (V(T)) and end-tidal P(C)(O(2)) (P(ET,C)(O(2))), the response being severely blunted in sleep. There is no agreement on the mechanisms underlying this ventilatory response. Six naive healthy males (aged 39-44) were studied supine with their heads in a positron emission tomography (PET) scanner to allow relative regional cerebral blood flow (rCBF) to be measured with H(2)(15)O given intravenously. A linearised resistive load (24 cmH(2)O (l s(-1))(-1)) could be added to the inspiratory limb of a breathing valve inserted into a tightly fitting facemask; inspiratory flow was measured with a pneumotachograph. The load was applied, without alerting the subject, when the radioactivity first reached the head. Six scans were performed with and without the load, in each subject. Relative rCBF contrasts between the loaded and unloaded breathing states showed significant activations in inferior parietal cortex, prefrontal cortex, midbrain, basal ganglia and multiple cerebellar sites. No activations were found in the primary sensorimotor cortex. The findings suggest that there is a pattern of motor behavioural response to the uncomfortable sensation that inspiration is impeded. This results in a prolongation of T(I), the maintenance of V(T) and a reduction in the degree of discomfort, presumably because of the reduction of mean negative pressure in the airways.
Figures


Similar articles
-
Motor task difficulty and brain activity: investigation of goal-directed reciprocal aiming using positron emission tomography.J Neurophysiol. 1997 Mar;77(3):1581-94. doi: 10.1152/jn.1997.77.3.1581. J Neurophysiol. 1997. PMID: 9084621 Clinical Trial.
-
Regional cerebral blood flow during volitional expiration in man: a comparison with volitional inspiration.J Physiol. 1993 Feb;461:85-101. doi: 10.1113/jphysiol.1993.sp019503. J Physiol. 1993. PMID: 8350282 Free PMC article.
-
Reduced cerebral blood flow response and compensation among patients with untreated hypertension.Neurology. 2005 Apr 26;64(8):1358-65. doi: 10.1212/01.WNL.0000158283.28251.3C. Neurology. 2005. PMID: 15851723
-
Human brain mapping under increasing cognitive complexity using regional cerebral blood flow measurements and positron emission tomography.Dan Med Bull. 2007 Nov;54(4):289-305. Dan Med Bull. 2007. PMID: 18208679 Review.
-
Intensity-dependent regional cerebral blood flow during 1-Hz repetitive transcranial magnetic stimulation (rTMS) in healthy volunteers studied with H215O positron emission tomography: I. Effects of primary motor cortex rTMS.Biol Psychiatry. 2003 Oct 15;54(8):818-25. doi: 10.1016/s0006-3223(03)00002-7. Biol Psychiatry. 2003. PMID: 14550681 Review.
Cited by
-
The effects of altered intrathoracic pressure on resting cerebral blood flow and its response to visual stimulation.Neuroimage. 2013 Feb 1;66:479-88. doi: 10.1016/j.neuroimage.2012.10.049. Epub 2012 Oct 27. Neuroimage. 2013. PMID: 23108273 Free PMC article.
-
Diaphragmatic motor cortex hyperexcitability in patients with chronic obstructive pulmonary disease.PLoS One. 2019 Dec 18;14(12):e0217886. doi: 10.1371/journal.pone.0217886. eCollection 2019. PLoS One. 2019. PMID: 31851669 Free PMC article.
-
Inspiratory resistances facilitate the diaphragm response to transcranial stimulation in humans.BMC Physiol. 2006 Jul 29;6:7. doi: 10.1186/1472-6793-6-7. BMC Physiol. 2006. PMID: 16875504 Free PMC article.
-
Functional connectivity and information flow of the respiratory neural network in chronic obstructive pulmonary disease.Hum Brain Mapp. 2016 Aug;37(8):2736-54. doi: 10.1002/hbm.23205. Epub 2016 Apr 5. Hum Brain Mapp. 2016. PMID: 27059277 Free PMC article.
-
Electroencephalographic detection of respiratory-related cortical activity in humans: from event-related approaches to continuous connectivity evaluation.J Neurophysiol. 2016 Apr;115(4):2214-23. doi: 10.1152/jn.01058.2015. Epub 2016 Feb 10. J Neurophysiol. 2016. PMID: 26864771 Free PMC article.
References
-
- Alexander GE, DeLong MR, Strick PL. Parallel organization of functionally segregated circuits linking basal ganglia and cortex. Annual Review of Neuroscience. 1986;9:9357–9381. - PubMed
-
- Andersen RA, Asanuma C, Essick G, Siegel RM. Corticocortical connections of anatomically and physiologically defined subdivisions within the inferior parietal lobule. Journal of Comparative Neurology. 1990;296:65–113. - PubMed
-
- Badr MS, Skatrud JB, Dempsey JA, Begle RL. Effect of mechanical loading on expiratory and inspiratory muscle activity during NREM sleep. Journal of Applied Physiology. 1990;68:1195–1202. - PubMed
-
- Barman SM. Brainstem control of cardiovascular function. In: Klemm WR, Vertes RP, editors. Brainstem Mechanisms of Behavior. New York: John Wiley & Sons; 1990.
-
- Berry M, Bannister LH, Standing SM. Gray's Anatomy. 38. New York: Churchill Livingston; 1995. Cerebellum; pp. 1027–1065.
Publication types
MeSH terms
Grants and funding
LinkOut - more resources
Full Text Sources