. 2002 Mar;109(6):837-43.
doi: 10.1172/JCI14789.

Expansion of pre-existing, lymph node-localized CD8+ T cells during supervised treatment interruptions in chronic HIV-1 infection

Affiliations

Expansion of pre-existing, lymph node-localized CD8+ T cells during supervised treatment interruptions in chronic HIV-1 infection

Marcus Altfeld et al. J Clin Invest. 2002 Mar.

Abstract

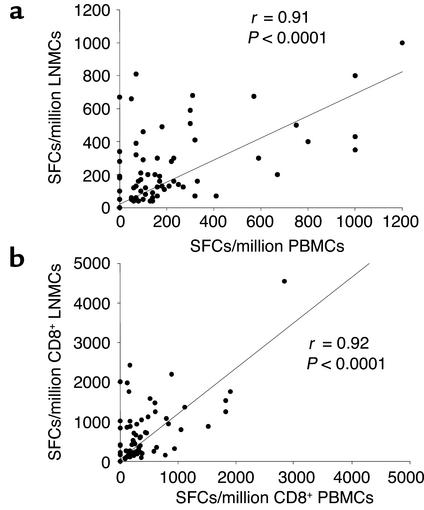
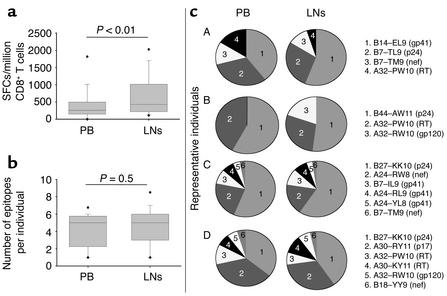
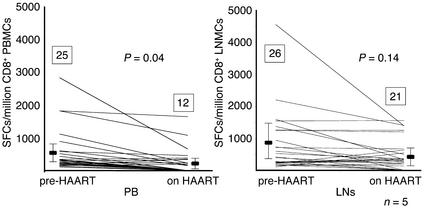
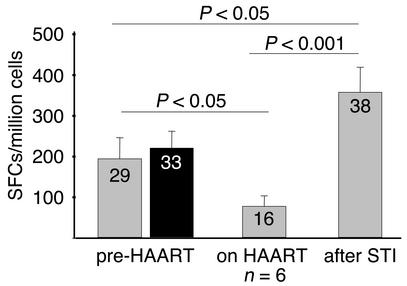
To date, most studies have focused on the characterization of HIV-1-specific cellular immune responses in the peripheral blood (PB) of infected individuals. Much less is known about the comparative magnitude and breadth of responses in the lymphoid tissue. This study analyzed HIV-1-specific CD8+ T cell responses simultaneously in PB and lymph nodes (LNs) of persons with chronic HIV-1 infection and assessed the dynamics of these responses during antiretroviral treatment and supervised treatment interruption (STI). In untreated chronic infection, the magnitude of epitope-specific CD8+ T cell activity was significantly higher in LNs than in PB. Responses decreased in both compartments during highly active antiretroviral therapy, but this decline was more pronounced in PB. During STI, HIV-1-specific CD8+ T cell responses in PB increased significantly. Enhancement in breadth and magnitude was largely due to the expansion of pre-existing responses in the LNs, with new epitopes infrequently targeted. Taken together, these data demonstrate that HIV-1-specific CD8+ T cells are preferentially located in the LNs, with a subset of responses exclusively detectable in this compartment. Furthermore, the enhanced CD8+ T cell responses observed during STI in chronically infected individuals is largely due to expansion of pre-existing virus-specific CD8+ T cells, rather than the induction of novel responses.


Figures

Figure 1
Figure 1
Correlation between CD8+ T cell responses to optimal HIV-1 CTL epitopes in the LNs and the PB. (a) Responses to each epitope in LNMCs and PBMCs are represented by a single dot. Frequencies are given as SFCs per million input PBMCs or LNMCs. (b) Frequencies after adaptation to the percentage of CD8+ T cells in each sample. Statistical analysis was performed using Spearman’s rank correlation.
Figure 2
Figure 2
(a) Magnitude of epitope-specific CD8+ T cell responses in PB and LNs. Magnitudes of responses in each compartment are given as SFCs/million CD8+ T cells, and presented as box plots showing the median and the 5th/95th percentile. Statistical significance of differences between the magnitude of responses to individual CTL epitopes in PB and LNs was calculated by two-tailed Student t test. (b) Breadth of epitope-specific CD8+ T cell responses in PB and LNs. Breadth of CD8+ T cell responses in the 15 individuals studied is presented as a box plot for each compartment, showing the median and the 5th/95th percentile. Statistical significance of differences between the breadth of responses in PB and LNs was calculated by two-tailed Student t test. (c) Contribution and hierarchy of individual HIV-1–specific CTL epitopes to the total virus-specific response in PB and LNs in four representative individuals (A–D). The individual epitopes recognized are specified in the legend and described by the restricting HLA class I allele, the first and last amino acids, the length of the peptide, and the HIV-1 protein.
Figure 3
Figure 3
Decline of HIV-1–specific CD8+ T cell responses to individual CTL epitopes upon treatment with HAART in the five individuals studied in the PB (left) and LNs (right). Epitope-specific CD8+ T cell responses are shown prior to the initiation of HAART (pre-HAART) and after 12 months on HAART (on HAART). Magnitudes of responses are given as SFCs/million CD8+ T cells, and each line demonstrates the evolution of responses in an individual CTL epitope. Mean magnitude of HIV-1–specific CD8+ T cell responses ± SD are shown before HAART and after 12 months on HAART, as is the total number of recognized CTL epitopes (numbers inside boxes) in the five individuals. Statistical significance of differences between the magnitude of responses to individual CTL epitopes before HAART and after 12 months on HAART were calculated by two-tailed Student t test.
Figure 4
Figure 4
Mean epitope-specific CD8+ T cell frequencies plus SD in the PB (gray bars) and LNs (black bar) prior to initiation of HAART, as well as mean epitope-specific CD8+ T cell frequencies plus SD in the PB(gray bars) after 12 months on HAART and at the time of peak viremia after STI in the six individuals studied. Mean magnitudes of epitope-specific responses are given as SFCs/million cells. The total number of targeted epitopes in the six individuals is shown in each box. Statistical significance of differences between the magnitude of responses to individual CTL epitopes was calculated by two-tailed Student t test.

References

    1. Klein MR, et al. Kinetics of Gag-specific cytotoxic T lymphocyte responses during the clinical course of HIV-1 infection: a longitudinal analysis of rapid progressors and long-term asymptomatics. J Exp Med. 1995;181:1365–1372. - PMC - PubMed
    1. Walker BD, et al. HIV-specific cytotoxic T lymphocytes in seropositive individuals. Nature. 1987;328:345–348. - PubMed
    1. Ogg GS, et al. Quantitation of HIV-1-specific cytotoxic T lymphocytes and plasma load of viral RNA. Science. 1998;279:2103–2106. - PubMed
    1. Borrow P, Lewicki H, Hahn BH, Shaw GM, Oldstone MB. Virus-specific CD8+ cytotoxic T-lymphocyte activity associated with control of viremia in primary human immunodeficiency virus type 1 infection. J Virol. 1994;68:6103–6110. - PMC - PubMed
    1. Koup RA, et al. Temporal association of cellular immune responses with the initial control of viremia in primary human immu-nodeficiency virus type 1 syndrome. J Virol. 1994;68:4650–4655. - PMC - PubMed

Publication types