. 2002 Mar 18;195(6):673-81.
doi: 10.1084/jem.20011758.

Transient receptor potential 1 regulates capacitative Ca(2+) entry and Ca(2+) release from endoplasmic reticulum in B lymphocytes

Affiliations

Transient receptor potential 1 regulates capacitative Ca(2+) entry and Ca(2+) release from endoplasmic reticulum in B lymphocytes

Yasuo Mori et al. J Exp Med. .

Abstract

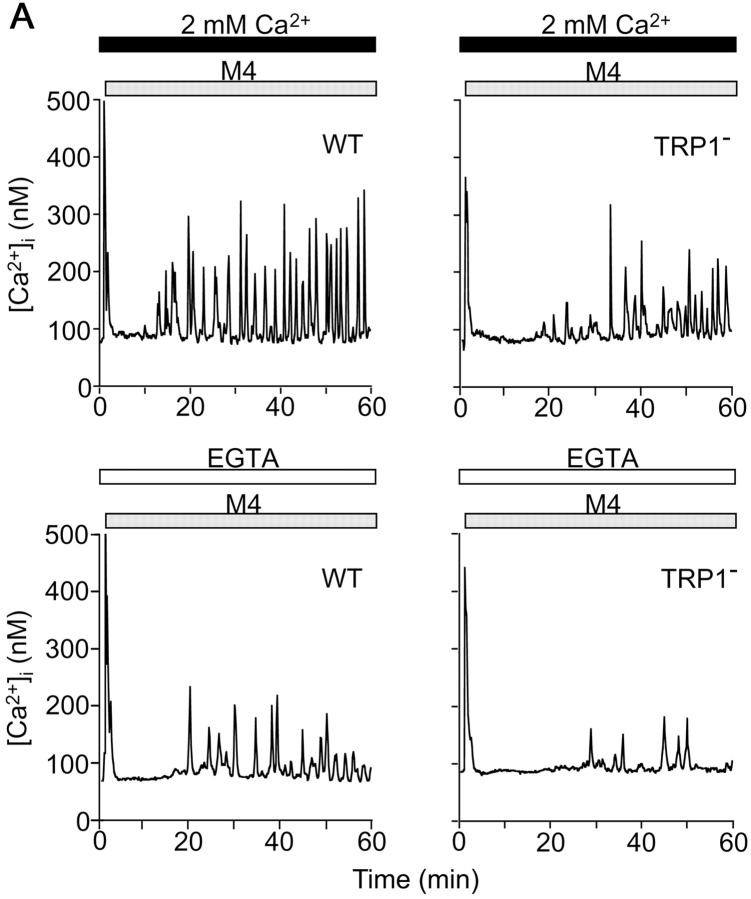
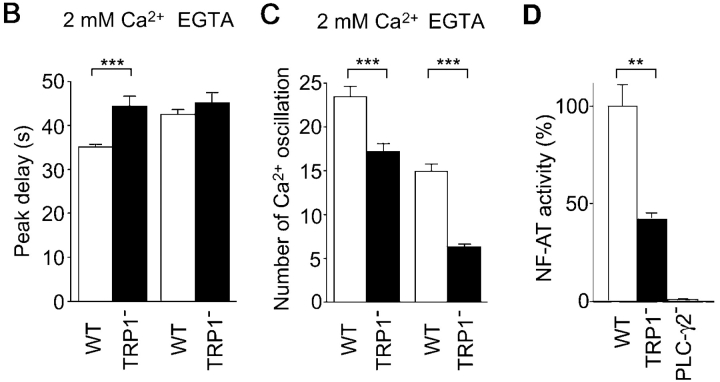
Capacitative Ca(2+) entry (CCE) activated by release/depletion of Ca(2+) from internal stores represents a major Ca(2+) influx mechanism in lymphocytes and other nonexcitable cells. Despite the importance of CCE in antigen-mediated lymphocyte activation, molecular components constituting this mechanism remain elusive. Here we demonstrate that genetic disruption of transient receptor potential (TRP)1 significantly attenuates both Ca(2+) release-activated Ca(2+) currents and inositol 1,4,5-trisphosphate (IP(3))-mediated Ca(2+) release from endoplasmic reticulum (ER) in DT40 B cells. As a consequence, B cell antigen receptor-mediated Ca(2+) oscillations and NF-AT activation are reduced in TRP1-deficient cells. Thus, our results suggest that CCE channels, whose formation involves TRP1 as an important component, modulate IP(3) receptor function, thereby enhancing functional coupling between the ER and plasma membrane in transduction of intracellular Ca(2+) signaling in B lymphocytes.


Figures

Figure 1.
Figure 1.
Targeted disruption of the TRP1 gene in DT40 B lymphocytes. Partial restriction map of chicken TRP1 gene (A), targeting construct (B), and expected structure of the disrupted allele (C). (D) Southern blot analysis of genomic DNAs from DT40 cells. Genomic DNAs were prepared from WT (+/+), neo-targeted (+/−), and neo/his-targeted (−/−) clones, digested with XbaI, and hybridized with a 3′-flanking probe. The restriction endonuclease cleavage site of XbaI is abbreviated as X. (E) Northern blot analysis of WT and TRP1-deficient DT40 cells (clone TRP1-14). (F) Immunolocalization of TRP1 in WT cells, and loss of its expression in TRP1-14 cells. The fluorescence images were acquired with a confocal laser microscope. (G) BCR expression on TRP1-deficient DT40 cells. DT40 cells were stained with FITC-conjugated anti–chicken IgM Ab.
Figure 2.
Figure 2.
Disruption of TRP1 gene attenuates BCR-induced Ca2+ mobilization in DT40 cells. Average time courses of Ca2+ responses evoked in the presence (A, 2 mM Ca2+) and absence (B, EGTA) of extracellular Ca2+ upon BCR stimulation with anti-BCR antibody M4 (1 μg/ml) in WT cells (white box), in a TRP1-deficient clone TRP1-14 (black box), and in TRP1-14 cells expressing recombinant hTRP1 (TRP1/14, black triangle). Anti-BCR antibody was applied as indicated by the horizontal bars above the traces. (C) Peak BCR-induced [Ca2+]i rises in WT (n = 75), in two independent TRP1-deficient clones, TRP1-14 (n = 31) and TRP1-16 (n = 39), and in TRP1-14 cells expressing recombinant hTRP1 (TRP1/14)(n = 22). The responses of the two independent TRP1-deficient clones were indistinguishable. Data points and columns are the mean ±SE. *P < 0.05; **P < 0.01; ***P < 0.001. P values are the results of Student's t test.
Figure 3.
Figure 3.
IP3-induced Ca2+ release is suppressed in TRP1-deficient cells. (A) Intact BCR-induced IP3 production in TRP1-deficient cells. Cells were stimulated with anti-BCR antibody M4 (1 μg/ml) for the indicated time. Data points are the mean ±SE from four experiments. (B) Western blot analysis demonstrating the IP3R-1 or IP3R-2 expression indistinguishable in WT and mutant cells using a polyclonal antibody against either IP3R-1 or IP3R-2. (C) The ER luminal Ca2+ concentration increased with activation of the Ca2+ pump, and declined upon application of IP3. (D) The level of activation of the IP3R can be quantitatively compared by the initial rate of Ca2+ release, which we estimated by fitting an exponential curve (continuous line) to the initial part of the Ca2+ decay signal (black circles). (E) IP3-concentration dependence of Ca2+ release. Release rates were obtained by fitting a single exponential to the initial part of Ca2+ decay signal measured in luminal Ca2+ monitoring (reference 27). The continuous curve and dotted curve represent the best fit hyperbolic equations, rmax/(1 + EC50/[IP3]), where rmax is the extrapolated values of the maximal rate of Ca2+ release, for Ca2+ release rates in WT and TRP1-deficient cells, respectively. rmax and EC50 were 0.153 s-1 and 0.66 μM in WT cells, and 0.118 s−1 and 0.83 μM in mutant cells. Data obtained from TRP1-14 and TRP1-16 were combined. Data points are the mean ±SE from six to seven experiments. **P < 0.01.
Figure 4.
Figure 4.
CCE is impaired in TRP1-deficient cells. TG-induced Ca2+ release and CCE. (A and B) (A) Time course of Ca2+ responses induced by external perfusion of 2 μM TG, that passively depletes internal Ca2+ stores in the Ca2+-free solution containing EGTA, and by subsequent addition of 2 mM extracellular Ca2+ to evoke CCE, in WT (white box), TRP1-14 (black box), and hTRP1-expressing TRP1-14 cells (TRP1/14, white triangle). The solutions contained 4 mM K+. (B) Peak [Ca2+]i rises attributable to Ca2+ release and entry induced by TG in WT, mutant clones, TRP1-14 and TRP1-16, and hTRP1-expressing TRP1-14 cells (TRP1/14). Experiments were performed in the 4 mM K+-containing, physiological salt solution (n = 114, 65, 55, and 35 for WT, TRP1-14, TRP1-16, and TRP1/14, respectively), in high K+ (30 mM) solution (n = 153, 106, and 86 for WT, TRP1-14, and TRP1-16, respectively), and in 8 mM K+ plus 2 μM valinomycin-containing solution (n = 36 and 19 for WT and TRP1-14, respectively). The responses of the two independent TRP1-deficient clones were indistinguishable. Data points and columns are the mean ±SE. **P < 0.01; ***P < 0.001. SOC currents induced by internal dialysis with 10 μM IP3 in DT40 cells (C and D). (C, left) Representative, high resolution current records at 10 s (top trace) and 200 s (lower trace) after whole cell break-in, subtracted with pooled leak currents (see Materials and Methods). The voltage ramp protocol is schematically shown on top. (Right) Average time courses of ionic currents evoked by 10 μM IP3 at –130 mV (indicated by an arrow in C in SOC-positive WT cells. Average time courses in TRP1-deficient cells were similar to WT cells. Spontaneous activation of SOC currents was not observed in the absence of intrapipette IP3, since [Ca2+]i in the pipette solution was clamped to ∼100 nM (see Materials and Methods). Data are mean ±SE. The whole-cell configuration of patch clamp recording is established at the time 0. (D) Number of WT and TRP1-deficient cells developing SOC currents in response to intracellular perfusion of 10 μM IP3. Only 20% of mutant cells show SOC current activation, while 90% of WT cells develops SOC current. (E) PCR analysis of genomic DNA demonstrating the TRP1-deficient preparations free from contamination of WT cells. PCR primers were designed as described in Materials and Methods to amplify the ∼2,080-bp genomic fragment in WT cells but not in mutant cells. Addition of 1/100 amount of genomic DNA from WT cells to that from the mutant line leads to clear PCR amplification of the WT ∼2,080-bp band, revealing that contamination of WT cells was <1% of the cell population, if at all.
Figure 5.
Figure 5.
Reduced Ca2+ oscillation and NF-AT activity in TRP1-deficient cells. (A) Representative Ca2+ responses upon BCR ligation in Ca2+-containing and Ca2+-free external solution in single WT and mutant DT40 cells. Anti-BCR antibody was applied as indicated by the horizontal bars above the traces. (B) Delay of Ca2+ response to reach initial peak after application of anti-BCR antibody. n = 90 and 88 for WT and TRP1, respectively, in Ca2+-containing solution, and n = 46 and 53 for WT and TRP1, respectively, in Ca2+-free external solution. (C) Number of Ca2+ oscillations within 60 min of BCR stimulation. n = 90 and 150 for WT and TRP1, respectively, in Ca2+-containing solution, and n = 89 and 139 for WT and TRP1, respectively, in Ca2+-free external solution. (D) NF-AT activity in WT and mutant cells. Cells transfected with the NF-AT luciferase gene were analyzed as described in Materials and Methods. The experiment shown is representative of three independent trials. Data points and columns are the mean ±SE. **P < 0.01; ***P < 0.001.
Figure 5.
Figure 5.
Reduced Ca2+ oscillation and NF-AT activity in TRP1-deficient cells. (A) Representative Ca2+ responses upon BCR ligation in Ca2+-containing and Ca2+-free external solution in single WT and mutant DT40 cells. Anti-BCR antibody was applied as indicated by the horizontal bars above the traces. (B) Delay of Ca2+ response to reach initial peak after application of anti-BCR antibody. n = 90 and 88 for WT and TRP1, respectively, in Ca2+-containing solution, and n = 46 and 53 for WT and TRP1, respectively, in Ca2+-free external solution. (C) Number of Ca2+ oscillations within 60 min of BCR stimulation. n = 90 and 150 for WT and TRP1, respectively, in Ca2+-containing solution, and n = 89 and 139 for WT and TRP1, respectively, in Ca2+-free external solution. (D) NF-AT activity in WT and mutant cells. Cells transfected with the NF-AT luciferase gene were analyzed as described in Materials and Methods. The experiment shown is representative of three independent trials. Data points and columns are the mean ±SE. **P < 0.01; ***P < 0.001.

References

    1. Clapham, D.E. 1995. Calcium signaling. Cell. 80:259–268. - PubMed
    1. Berridge, M.J., M.D. Bootman, and P. Lipp. 1998. Calcium-a life and death signal. Nature. 395:645–648. - PubMed
    1. Putney, J.W., and G.S.J. Bird. 1993. The signal for capacitative calcium entry. Cell. 75:199–201. - PubMed
    1. Dolmetsch, R.E., R.S. Lewis, C.C. Goodnow, and J.I. Healy. 1997. Differential activation of transcription factors induced by Ca2+ response amplitude and duration. Nature. 386:855–858. - PubMed
    1. Li, W.-H., J. Llopis, M. Whitney, G. Zlokarnik, and R.Y. Tsien. 1998. Cell-permeant caged InsP3 ester shows that Ca2+ spike frequency can optimize gene expression. Nature. 392:936–941. - PubMed

Publication types

Substances