. 2002 Mar 18;195(6):683-94.
doi: 10.1084/jem.20010898.

Major histocompatibility complex class II presentation of cell-associated antigen is mediated by CD8alpha+ dendritic cells in vivo

Affiliations

Major histocompatibility complex class II presentation of cell-associated antigen is mediated by CD8alpha+ dendritic cells in vivo

Yanet Valdez et al. J Exp Med. .

Abstract

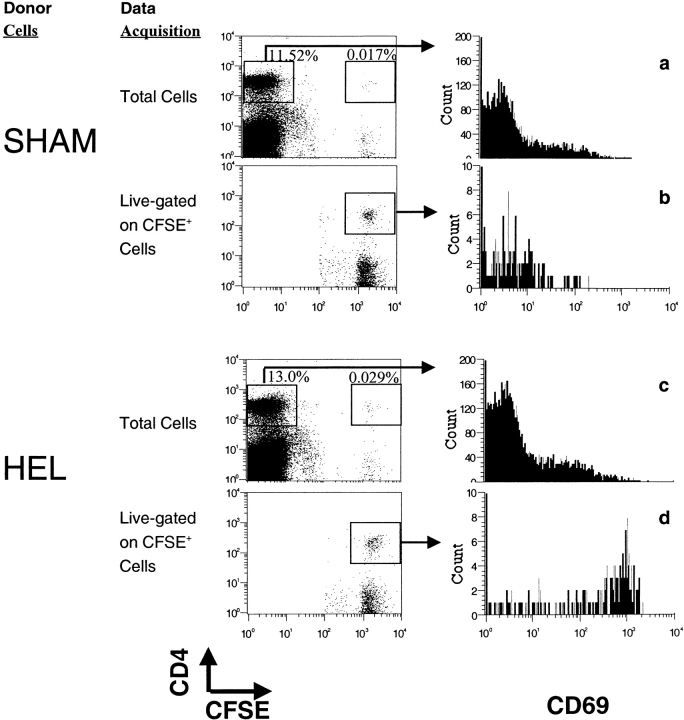
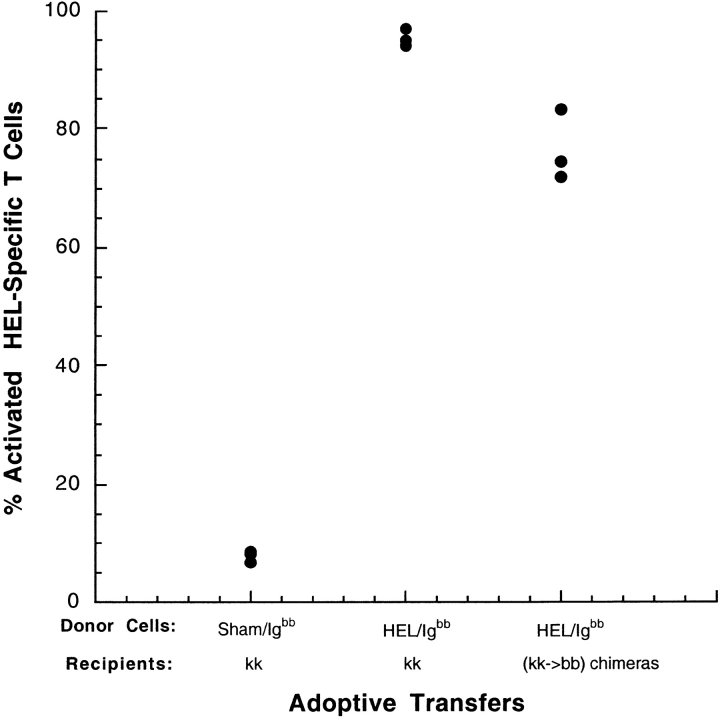
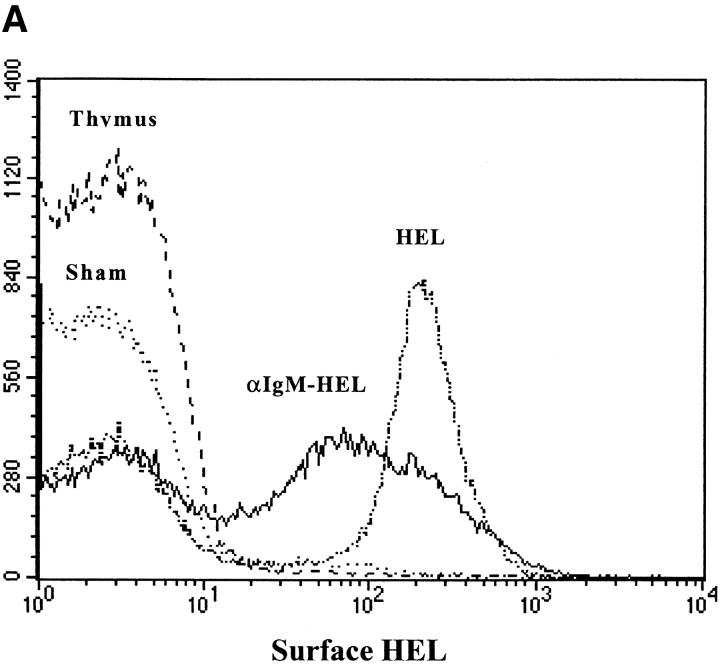
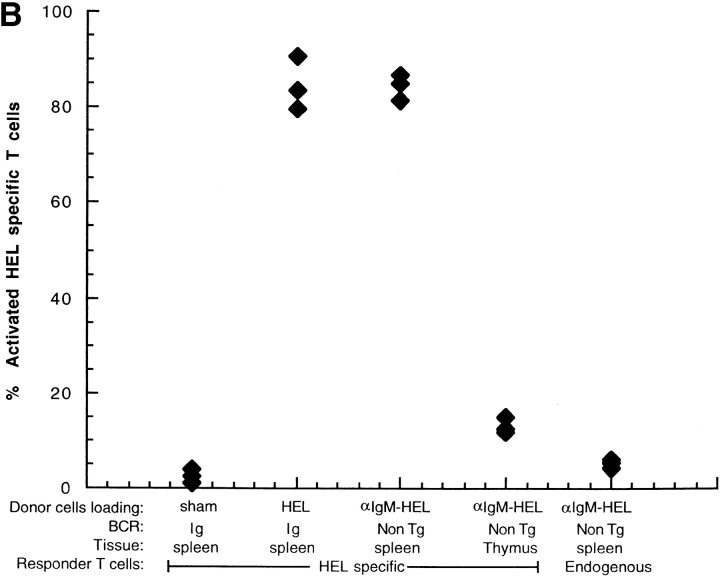
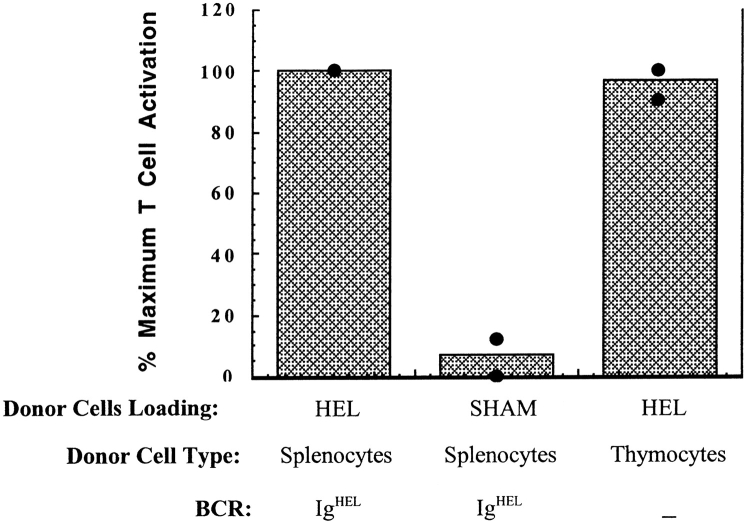
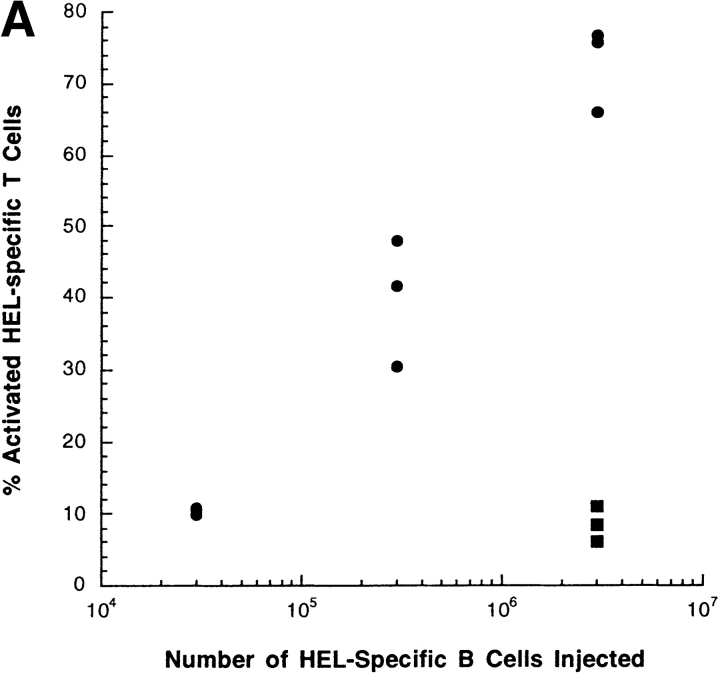
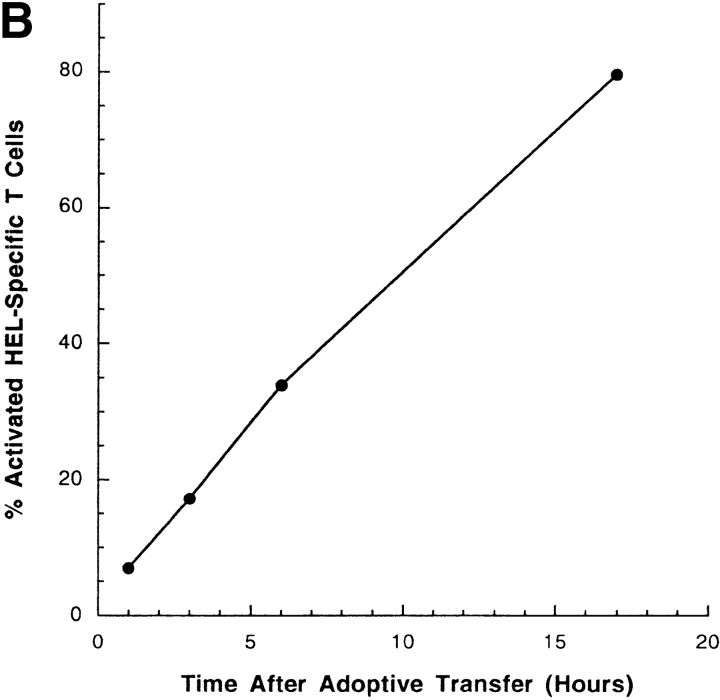
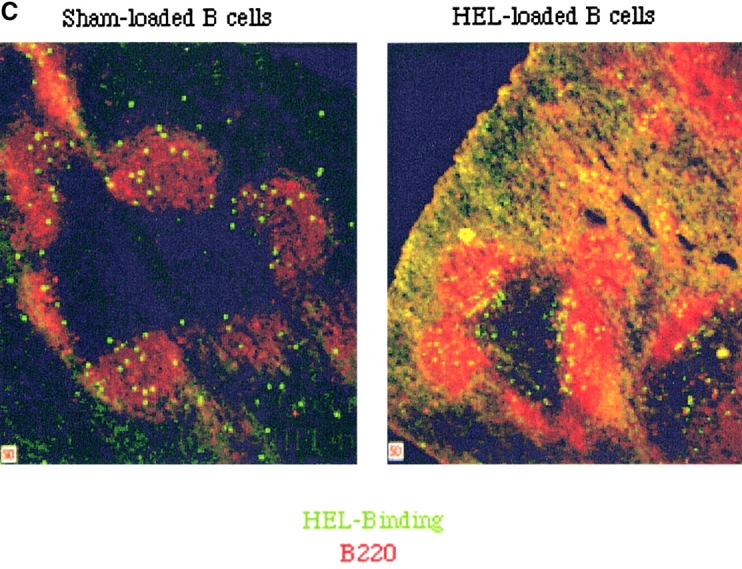
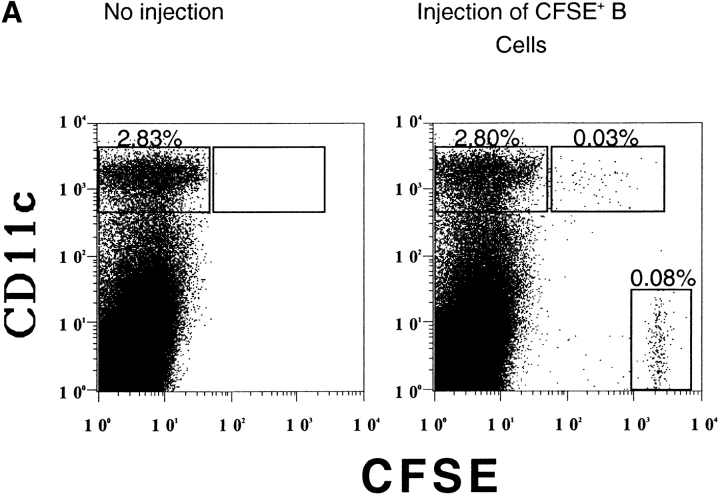
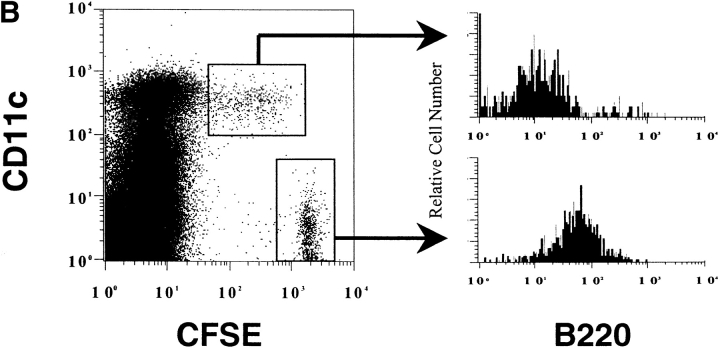
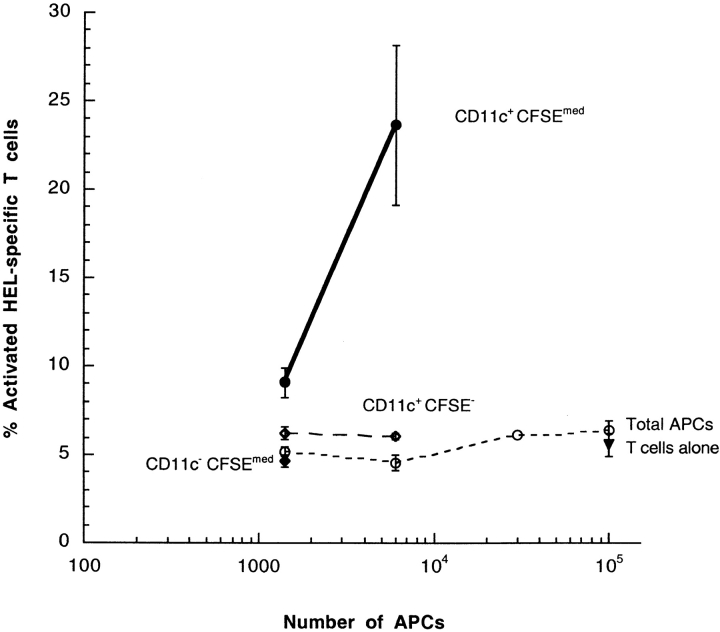
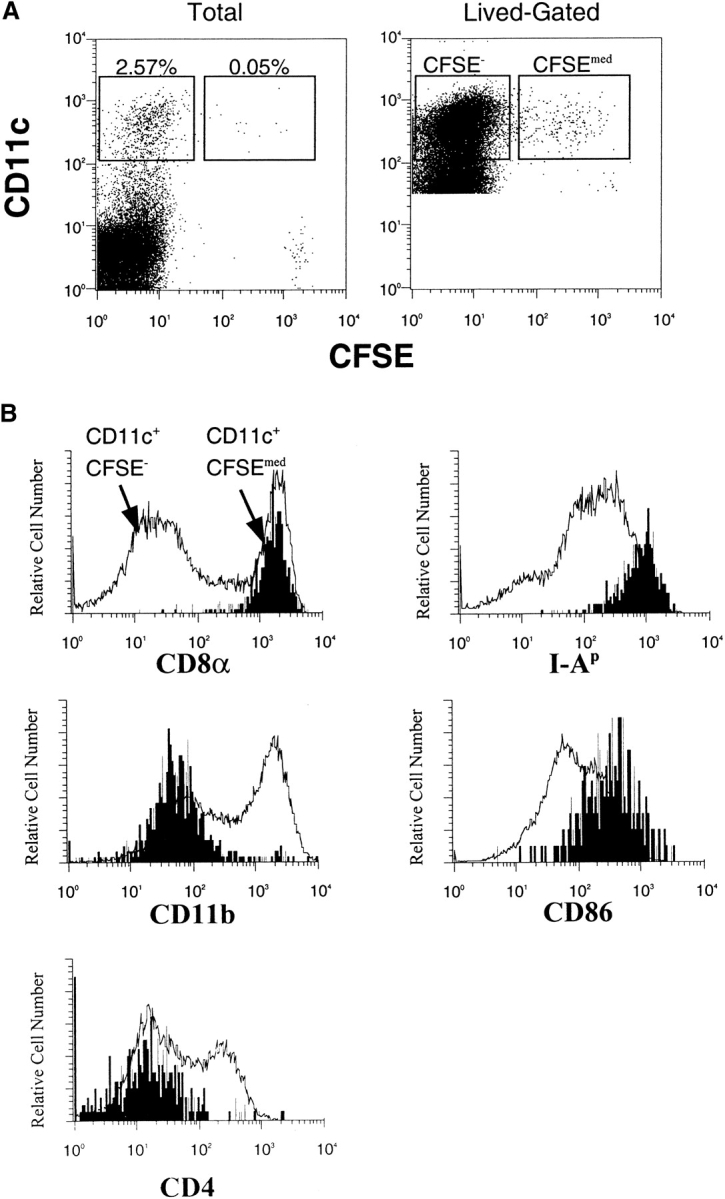
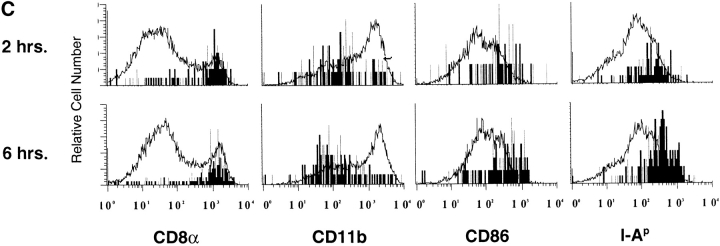
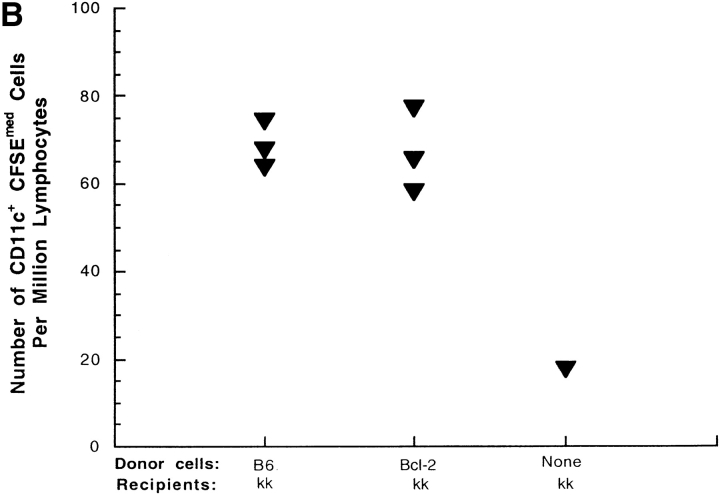
Antigen-specific B cells express major histocompatibility complex class II and can present antigen directly to T cells. Adoptive transfer experiments using transgenic B and T cells demonstrated that antigen-specific B cells can also efficiently transfer antigen to another cell for presentation to T cells in vivo. To identify the antigen-presenting cell that receives antigens from B cells, a strategy was developed to follow the traffic of B cell-derived proteins in vivo. B cells were labeled with the fluorescent dye CFSE and loaded with antigen, before adoptive transfer into recipient mice. Populations of splenocytes from the recipient mice were later assayed for the presence of fluorescent proteins and for the ability to activate T cells. A small number of CD8alpha+CD4-CD11b(lo) dendritic cells (DCs) contain proteins transferred from B cells and these DCs effectively present antigens derived from the B cells to T cells. The results suggest that CD8alpha+ DCs sample the cells and membranes in their environment for presentation to T cells circulating through the T cell zone. This function of CD8alpha+ DCs may be relevant to the priming of an immune response or the induction of T cell tolerance.


Figures

Figure 1.
Figure 1.
HEL-loaded, HEL-specific H-2bb B cells mediate the activation of H-2kk-restricted HEL-specific T cells in vivo. HEL-specific 3A9, transgenic T cells from the B10.BR(H-2kk) background were labeled with CFSE and adoptively transferred intravenously into intact B10.BR recipients. Equal number of HEL-specific IgHEL transgenic B cells on the C57Bl/6 (H-2bb) background were loaded with HEL in vitro or sham loaded, then adoptively transferred into the recipients containing transferred T cells. 16 h later, the recipient mice were killed and the splenocytes analyzed by flow cytometry. Files containing data for total lymphocytes as well as live-gated files containing data only for CFSE+ cells were collected for each sample. Data were gated for lymphocytes in FSC, SSC, and B220+ cells were eliminated from the analysis by negative gating. T cell activation was measured by the expression of the early activation marker CD69 by nontransgenic CD4+ T cells (a and c) or by transgenic CFSE+ CD4+ (b and d). Data are representative of three individuals from each of more than eight experiments.
Figure 2.
Figure 2.
Presentation of transferred antigen does not require an allogeneic response. HEL-specific IgHEL(H-2bb) transgenic splenocytes were loaded with PBS or HEL ex vivo, and injected intravenously into B10.BR (H-2kk) mice which had been previously seeded with CFSE-labeled 3A9 HEL-specific T cells (H-2kk) by adoptive transfer. 20 h after transfer, mice were killed and the spleens prepared and analyzed by flow cytometry. Data were gated to include lymphocytes and exclude dead cells, and for CFSE+ CD4+ HEL-specific T cells. CD69 expression was used as a measure of T cell activation. Each point represent a single mouse.
Figure 3.
Figure 3.
Antigen concentrated by nontransgenic B cells is effectively transferred for presentation to T cells in vivo. HEL was loaded onto nontransgenic B6 B cells (H-2bb) using an anti-IgM antibody conjugated with HEL to target HEL to the BCR. (A) HEL loading was measured by flow cytometry using the HEL-binding antibody, HyHEL-9. The histograms represent surface HEL on: IgHEL transgenic B cells after loading with HEL (HEL), nontransgenic B cells after loading with anti–IgM-HEL conjugate (αIgM-HEL), nontransgenic thymocytes after loading with anti-IgM-HEL conjugate (thymus), and IgHEL transgenic B cells after sham loading (Sham). Data were gated for live lymphocytes and for B220+ cells. (B) Loaded donor cells were transferred into B10.BR recipients which had been previously seeded with CFSE-labeled 3A9 HEL-specific transgenic T cells. 14 h after transfer, mice were killed and the spleens prepared for flow cytometry. Data were gated for live lymphocytes and either CFSE+CD4+ responder T cells (HEL-specific) or CFSECD4+ responder T cells (endogenous), and activation was measured using CD69. Each point represents a single mouse. Data are representative of two experiments.
Figure 3.
Figure 3.
Antigen concentrated by nontransgenic B cells is effectively transferred for presentation to T cells in vivo. HEL was loaded onto nontransgenic B6 B cells (H-2bb) using an anti-IgM antibody conjugated with HEL to target HEL to the BCR. (A) HEL loading was measured by flow cytometry using the HEL-binding antibody, HyHEL-9. The histograms represent surface HEL on: IgHEL transgenic B cells after loading with HEL (HEL), nontransgenic B cells after loading with anti–IgM-HEL conjugate (αIgM-HEL), nontransgenic thymocytes after loading with anti-IgM-HEL conjugate (thymus), and IgHEL transgenic B cells after sham loading (Sham). Data were gated for live lymphocytes and for B220+ cells. (B) Loaded donor cells were transferred into B10.BR recipients which had been previously seeded with CFSE-labeled 3A9 HEL-specific transgenic T cells. 14 h after transfer, mice were killed and the spleens prepared for flow cytometry. Data were gated for live lymphocytes and either CFSE+CD4+ responder T cells (HEL-specific) or CFSECD4+ responder T cells (endogenous), and activation was measured using CD69. Each point represents a single mouse. Data are representative of two experiments.
Figure 4.
Figure 4.
HEL-loaded thymocytes transfer antigen for presentation to T cells in vivo. HEL was loaded onto the surface of thymocytes by first surface biotinylating the thymocytes, then incubating with streptavidin, then finally incubating with HEL-biotin. Effective biotinylation and HEL-loading were confirmed by flow cytometry. HEL-loaded B6 thymocytes or HEL-loaded or sham-loaded B6 IgHEL B cells were injected intravenously into B10.BR recipient mice previously seeded with CFSE-labeled HEL-specific 3A9 transgenic T cells. 12–16 h later, mice were killed and spleens prepared for flow cytometry. Data were gated on live lymphocytes and CFSE+CD4+ responder T cells. CD69 expression was used as a measure of T cell activation. The percentage of CFSE+CD4+ cells expressing CD69 in mice receiving HEL-loaded IgHEL cells was considered maximal T cell activation and was >50% in both experiments. Data are presented from single individuals in two separate experiments. Similar results were obtained in a third experiment, except that the transfer of HEL-loaded thymocytes induced 30% more activation than HEL-loaded IgHEL cells. Each point represents an individual mouse.
Figure 5.
Figure 5.
The percentage of HEL-specific T cells activation increases with the number of cells and the time after adoptive transfer. (A) Varying numbers of HEL or sham-loaded, HEL-specific transgenic B cells (H-2bb) were adoptively transferred into intact B10.BR mice (H-2kk), which had been previously seeded with CFSE-labeled, HEL-specific transgenic T cells (H-2kk). 16 h later, the recipient mice were killed and the splenocytes analyzed by flow cytometry. Squares represent sham-loaded and circles represent HEL-loaded transgenic B cells. (B) 106 HEL-specific transgenic B cells were adoptively transferred into intact B10.BR mice which had been previously seeded with 106 CFSE-labeled, HEL-specific transgenic T cells. The recipient mice were killed at different time point after the transfer and the spleens were prepared and analyzed by flow cytometry. Data were gated as in Fig. 1. (C) HEL-specific B cells pulsed with HEL ex vivo and injected intravenously are excluded to the margins of the B cell follicles in the spleen. Splenocytes from IgHEL transgenic mice were pulsed with HEL or PBS alone, washed and transferred into intact syngenic recipients by intravenous injections. Mice were killed after 12 h and the spleens flash frozen. Cryosections were stained and analyzed by fluorescent confocal microscopy.
Figure 5.
Figure 5.
The percentage of HEL-specific T cells activation increases with the number of cells and the time after adoptive transfer. (A) Varying numbers of HEL or sham-loaded, HEL-specific transgenic B cells (H-2bb) were adoptively transferred into intact B10.BR mice (H-2kk), which had been previously seeded with CFSE-labeled, HEL-specific transgenic T cells (H-2kk). 16 h later, the recipient mice were killed and the splenocytes analyzed by flow cytometry. Squares represent sham-loaded and circles represent HEL-loaded transgenic B cells. (B) 106 HEL-specific transgenic B cells were adoptively transferred into intact B10.BR mice which had been previously seeded with 106 CFSE-labeled, HEL-specific transgenic T cells. The recipient mice were killed at different time point after the transfer and the spleens were prepared and analyzed by flow cytometry. Data were gated as in Fig. 1. (C) HEL-specific B cells pulsed with HEL ex vivo and injected intravenously are excluded to the margins of the B cell follicles in the spleen. Splenocytes from IgHEL transgenic mice were pulsed with HEL or PBS alone, washed and transferred into intact syngenic recipients by intravenous injections. Mice were killed after 12 h and the spleens flash frozen. Cryosections were stained and analyzed by fluorescent confocal microscopy.
Figure 6.
Figure 6.
A small subpopulation of CD11c1 cells acquires proteins from fluorescent-labeled B cells. Purified HEL-specific transgenic B cells on the C57Bl/6 (H-2bb) background were labeled with CFSE, loaded with HEL, and adoptively transferred into unmanipulated B10.BR (H-2kk) recipients. 12 h later the mice were killed and the spleens were gently prepared, stained, and analyzed by flow cytometry. The very bright CFSE+, CD11c population represents the transferred B cells (0.08%). Data were gated using a wide FSC, SSC gate which included lymphocytes, large cells, and granular cells. Dead cells were eliminated from the analysis by negative gating using 7-AAD. Data are representative of 20 independent experiments. (B) CFSE-labeled B cells are not adhered to the surface of the DCs. The CFSEhi transferred B cells and the CD11c+, CFSEmed populations identified in Fig. 2 were analyzed for the expression of the B cell marker, B220, by flow cytometry. Data were gated as in Fig. 2. The data are representative of three independent experiments.
Figure 6.
Figure 6.
A small subpopulation of CD11c1 cells acquires proteins from fluorescent-labeled B cells. Purified HEL-specific transgenic B cells on the C57Bl/6 (H-2bb) background were labeled with CFSE, loaded with HEL, and adoptively transferred into unmanipulated B10.BR (H-2kk) recipients. 12 h later the mice were killed and the spleens were gently prepared, stained, and analyzed by flow cytometry. The very bright CFSE+, CD11c population represents the transferred B cells (0.08%). Data were gated using a wide FSC, SSC gate which included lymphocytes, large cells, and granular cells. Dead cells were eliminated from the analysis by negative gating using 7-AAD. Data are representative of 20 independent experiments. (B) CFSE-labeled B cells are not adhered to the surface of the DCs. The CFSEhi transferred B cells and the CD11c+, CFSEmed populations identified in Fig. 2 were analyzed for the expression of the B cell marker, B220, by flow cytometry. Data were gated as in Fig. 2. The data are representative of three independent experiments.
Figure 7.
Figure 7.
Splenic DCs which receive transferred proteins in vivo (CD11c+, CFSEmed) directly activate HEL-specific T cells. Purified HEL-specific transgenic B cells on the C57Bl/6 (H-2bb) background were labeled with CFSE, loaded with HEL ex vivo and adoptively transferred into unmanipulated B10.BR (H-2kk) recipients. Populations of DCs were tested for the ability to directly activate T cells in vitro. The CD11c+ CFSE, CD11c+ CFSEmed, and CD11c CFSEmed populations identified in the Figure were sorted by flow cytometry and cultured overnight in vitro with HEL-specific T cells. The purity of the sorted CD11c+, CFSEmed population was 89%. Data were gated for live lymphocytes. In the presence of exogenous HEL, 70.8% of HEL-specific T cells expressed CD69, in the absence of antigen, 5.6% of HEL-specific T cells expressed CD69. All points are data for three culture wells, except for one point, without error bars in the total APC which represents the mean of two wells. Error bars represent the SD. The functional data are representative of six independent experiments.
Figure 8.
Figure 8.
Splenic DCs containing transferred proteins express high levels of CD8α, I-A, and CD86. Purified HEL-specific transgenic B cells on the C57Bl/6 (H-2bb) background were labeled with CFSE, loaded with HEL ex vivo, and adoptively transferred into unmanipulated B10.BR (H-2kk) recipients. (A) Data were first collected for total live cells, and then subsequent data were collected using lived-gating on CD11c+ to collect sufficient events for analysis. (B) Lived-gated files were gated in the CD11c+, CFSE and CD11c+, CFSEmed populations identified in the Figure and were analyzed for the expression of surface markers by flow cytometry. Data were gated as in Fig. 6. The data are representative of three independent experiments. (C) Stable surface phenotype of CD11c+CFSEmed early after donor cells injections. B6 splenocytes (H-2bb) were labeled with the dye CFSE and adoptively transferred into B10.BR recipients (H-2kk) by intravenous injection. The recipient mice were killed 2–6 h after the injections. Spleens were prepared and analyzed by flow cytometry. The CD11c+ CFSE and CD11c+ CFSEmed populations were identified, then analyzed for the expression of surface markers. Data were gated as in the Figure.
Figure 8.
Figure 8.
Splenic DCs containing transferred proteins express high levels of CD8α, I-A, and CD86. Purified HEL-specific transgenic B cells on the C57Bl/6 (H-2bb) background were labeled with CFSE, loaded with HEL ex vivo, and adoptively transferred into unmanipulated B10.BR (H-2kk) recipients. (A) Data were first collected for total live cells, and then subsequent data were collected using lived-gating on CD11c+ to collect sufficient events for analysis. (B) Lived-gated files were gated in the CD11c+, CFSE and CD11c+, CFSEmed populations identified in the Figure and were analyzed for the expression of surface markers by flow cytometry. Data were gated as in Fig. 6. The data are representative of three independent experiments. (C) Stable surface phenotype of CD11c+CFSEmed early after donor cells injections. B6 splenocytes (H-2bb) were labeled with the dye CFSE and adoptively transferred into B10.BR recipients (H-2kk) by intravenous injection. The recipient mice were killed 2–6 h after the injections. Spleens were prepared and analyzed by flow cytometry. The CD11c+ CFSE and CD11c+ CFSEmed populations were identified, then analyzed for the expression of surface markers. Data were gated as in the Figure.
Figure 9.
Figure 9.
The number of DCs containing transferred proteins increases linearly with the number of transferred donor cells. Varying numbers of CFSE-labeled B6 (H-2bb) or B10.BR (H-2kk) splenocytes were adoptively transferred into B10.BR recipients by intravenous injection. 18 h after the transfer, the mice were killed and the spleens were prepared and analyzed by flow cytometry for the presence of CD11c+CFSEmed cells. Data were gated using a wide FCS, SSC gate that includes lymphocytes and larger granular cells. Dead cells were eliminated by negative gating using 7-AAD. Each point represents a single mouse. The data is representative of five independent experiments.
Figure 10.
Figure 10.
Overexpression of Bcl-2 by B cells decreases passive death in vitro but does not affect DC acquisition of transferred proteins. (A) Purified B cells from C57BL/6 stock mice and from C57BL/6-TgN(22Wehi) transgenic mice, which overexpress Bcl-2 were labeled with CFSE and cultured in complete media for 16–18 h. The cells were then washed and stained with 7-AAD and B220 and analyzed by flow cytometry. Data were gated for B220+ cells and 7-AAD was used as a measure of cell death. Data represent the mean of triplicate cultures and error bars represent standard deviation. The data are representative of two independent experiments. (B) Purified B cells were labeled with CFSE and injected intravenously into B10BR (H-2kk) recipients. 16 h later, mice were killed and the splenocytes were prepared and analyzed by flow cytometry. Data were gated to exclude dead cells and red blood cells. CD11c+ and CFSE+ were gated and counted. Each point represent a single mouse. The data represent three independent experiments.
Figure 10.
Figure 10.
Overexpression of Bcl-2 by B cells decreases passive death in vitro but does not affect DC acquisition of transferred proteins. (A) Purified B cells from C57BL/6 stock mice and from C57BL/6-TgN(22Wehi) transgenic mice, which overexpress Bcl-2 were labeled with CFSE and cultured in complete media for 16–18 h. The cells were then washed and stained with 7-AAD and B220 and analyzed by flow cytometry. Data were gated for B220+ cells and 7-AAD was used as a measure of cell death. Data represent the mean of triplicate cultures and error bars represent standard deviation. The data are representative of two independent experiments. (B) Purified B cells were labeled with CFSE and injected intravenously into B10BR (H-2kk) recipients. 16 h later, mice were killed and the splenocytes were prepared and analyzed by flow cytometry. Data were gated to exclude dead cells and red blood cells. CD11c+ and CFSE+ were gated and counted. Each point represent a single mouse. The data represent three independent experiments.

References

    1. Bennett, S.R., F.R. Carbone, F. Karamalis, R.A. Flavell, J.F. Miller, and W.R. Heath. 1998. Help for cytotoxic-T-cell responses is mediated by CD40 signalling. Nature. 393:478–480. - PubMed
    1. Townsend, S.E., and C.C. Goodnow. 1998. Abortive proliferation of rare T cells induced by direct or indirect antigen presentation by rare B cells in vivo. J. Exp. Med. 187:1611–1621. - PMC - PubMed
    1. Batista, F.D., D. Iber, and M.S. Neuberger. 2001. B cells acquire antigen from target cells after synapse formation. Nature. 411:489–494. - PubMed
    1. Raposo, G., H.W. Nijman, W. Stoorvogel, R. Liejendekker, C.V. Harding, C.J. Melief, and H.J. Geuze. 1996. B lymphocytes secrete antigen-presenting vesicles. J. Exp. Med. 183:1161–1172. - PMC - PubMed
    1. Thery, C., A. Regnault, J. Garin, J. Wolfers, L. Zitvogel, P. Ricciardi-Castagnoli, G. Raposo, and S. Amigorena. 1999. Molecular characterization of dendritic cell-derived exosomes. Selective accumulation of the heat shock protein hsc73. J. Cell Biol. 147:599–610. - PMC - PubMed

Publication types

Substances