. 2002 Mar 18;195(6):747-57.
doi: 10.1084/jem.20011299.

Epidermal transglutaminase (TGase 3) is the autoantigen of dermatitis herpetiformis

Affiliations

Epidermal transglutaminase (TGase 3) is the autoantigen of dermatitis herpetiformis

Miklós Sárdy et al. J Exp Med. .

Abstract

Gluten sensitivity typically presents as celiac disease, a common chronic small intestinal disorder. However, in certain individuals it is associated with dermatitis herpetiformis, a blistering skin disease characterized by granular IgA deposits in the papillary dermis. While tissue transglutaminase has been implicated as the major autoantigen of gluten sensitive disease, there has been no explanation as to why this condition appears in two distinct forms. Here we show that while sera from patients with either form of gluten sensitive disease react both with tissue transglutaminase and the related enzyme epidermal (type 3) transglutaminase, antibodies in patients having dermatitis herpetiformis show a markedly higher avidity for epidermal transglutaminase. Further, these patients have an antibody population specific for this enzyme. We also show that the IgA precipitates in the papillary dermis of patients with dermatitis herpetiformis, the defining signs of the disease, contain epidermal transglutaminase, but not tissue transglutaminase or keratinocyte transglutaminase. These findings demonstrate that epidermal transglutaminase, rather than tissue transglutaminase, is the dominant autoantigen in dermatitis herpetiformis and explain why skin symptoms appear in a proportion of patients having gluten sensitive disease.


Figures

Figure 1.
Figure 1.
SDS-PAGE analysis of TGc and TGe after purification. Positions of molecular mass standards (kD) are indicated on the left. Arrows show the start and end lines of the gel.
Figure 2.
Figure 2.
Analysis of serum anti-TGe and anti-TGc IgA. Serum concentrations of IgA Abs (in AU) against human TGc (A) and TGe (B) in healthy individuals (H), other controls (CTRL), patients having untreated CD or DH, as well as those on a complete or incomplete gluten-free diet (CDG and DHG, respectively). 100 AU corresponds to 16.78 μg IgA/ml of serum in the TGc ELISA and 2.45 μg IgA/ml in the TGe ELISA.
Figure 2.
Figure 2.
Analysis of serum anti-TGe and anti-TGc IgA. Serum concentrations of IgA Abs (in AU) against human TGc (A) and TGe (B) in healthy individuals (H), other controls (CTRL), patients having untreated CD or DH, as well as those on a complete or incomplete gluten-free diet (CDG and DHG, respectively). 100 AU corresponds to 16.78 μg IgA/ml of serum in the TGc ELISA and 2.45 μg IgA/ml in the TGe ELISA.
Figure 3.
Figure 3.
Transglutaminase inhibition ELISAs, typical examples of inhibition curves. Each diagram shows the effect of preincubation on the remaining IgA Ab reactivity in one single serum sample from a patient with untreated CD (A and C) or DH (B and D). On the vertical axis is the remaining IgA Ab reactivity against TGc (A and B) or TGe (C and D) given in percentage of the buffer control, on the horizontal axis are inhibitor amounts on a logarithmic scale used for preincubation. The control was preincubated with buffer only, the other samples with a serial dilution of TGc (continuous line) or TGe (dashed line). The TGe is seen to be an effective inhibitor of IgA Abs against TGe only in DH patients (D), but not in individuals with CD (C) (see group analysis in Fig. 4, statistics in the text). TGc has the greatest inhibitory effect on IgA Abs against TGc in CD patients (A).
Figure 3.
Figure 3.
Transglutaminase inhibition ELISAs, typical examples of inhibition curves. Each diagram shows the effect of preincubation on the remaining IgA Ab reactivity in one single serum sample from a patient with untreated CD (A and C) or DH (B and D). On the vertical axis is the remaining IgA Ab reactivity against TGc (A and B) or TGe (C and D) given in percentage of the buffer control, on the horizontal axis are inhibitor amounts on a logarithmic scale used for preincubation. The control was preincubated with buffer only, the other samples with a serial dilution of TGc (continuous line) or TGe (dashed line). The TGe is seen to be an effective inhibitor of IgA Abs against TGe only in DH patients (D), but not in individuals with CD (C) (see group analysis in Fig. 4, statistics in the text). TGc has the greatest inhibitory effect on IgA Abs against TGc in CD patients (A).
Figure 4.
Figure 4.
Effect of preincubation of sera from patients with CD (n = 36) or DH (n = 34). On the vertical axis, remaining IgA Ab reactivity against TGe is indicated in percentage of the buffer control. The four dot diagrams on the left show the inhibitory effect of preincubation with 32 ng of TGc (c) or TGe (e) on the remaining IgA Ab reactivity of sera from patients with CD and DH. The four dot diagrams on the right demonstrate the same using 1 μg of TGc or TGe for preincubation. The asterisks on top of connecting lines show the degree of significance in the difference between the two groups of samples so linked: *P < 0.05; **P < 0.01; ***P < 0.001.
Figure 5.
Figure 5.
Affinity purification of the Ab population directed against TGe. Sera from CD and DH patients were circulated over columns of Sepharose 4B to which TGc had been covalently coupled. The immunodepleted fraction was then applied to columns carrying TGe. Unprocessed serum samples (S) and eluates from the washed TGe column (El) were compared for TGe and TGc immunoreactivity. The depletion worked with high efficiency and there was little or no reactivity in the TGc ELISA. In the TGe ELISA, the eluates from DH patients showed significant levels of TGe immunoreactivity, while those of CD patients generally failed to give a signal. Hence patients with DH have significant levels of Abs directed specifically against TGe which do not cross react with TGc, these Abs are absent in CD.
Figure 6.
Figure 6.
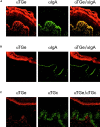
Colocalization of IgA and TGe in the papillary dermis of DH patients. (A) In DH patients, TGe shows normal distribution pattern in the epidermis; typical precipitates are present, however, in the upper dermis. In these precipitates, the TGe (red) and the IgA (green) colocalize as visualized with a confocal microscope (yellow). (B) The TGe precipitates are absent in linear IgA dermatosis, a bullous skin disease with linear IgA precipitates in the upper dermis, suggesting that TGe deposits are specific markers for DH. In addition, this also demonstrates the absence of cross-reactivity of anti-TGe Abs with IgA. (C) The TGe (and the IgA, data not shown) precipitates do not colocalize with TGc.

References

    1. Fry, L. 1995. Dermatitis herpetiformis. Baillière. Clin. Gastr. 9:371–394. - PubMed
    1. Sollid, L.M. 2000. Molecular basis of celiac disease. Annu. Rev. Immunol. 18:53–81. - PubMed
    1. Dieterich, W., T. Ehnis, M. Bauer, P. Donner, U. Volta, E.O. Riecken, and D. Schuppan. 1997. Identification of tissue transglutaminase as the autoantigen of celiac disease. Nat. Med. 3:797–801. - PubMed
    1. Dieterich, W., E. Laag, L. Bruckner-Tudermann, T. Reunala, S. Kárpáti, T. Zágoni, E.O. Riecken, and D. Schuppan. 1999. Antibodies to tissue transglutaminase as serologic markers in patients with dermatitis herpetiformis. J. Invest. Dermatol. 113:133–136. - PubMed
    1. Dieterich, W., E. Laag, H. Schöpper, U. Volta, A. Ferguson, H. Gillett, E.O. Riecken, and D. Schuppan. 1998. Autoantibodies to tissue transglutaminase as predictors of celiac disease. Gastroenterology. 115:1317–1321. - PubMed

Publication types

MeSH terms