. 2002 Mar 18;195(6):759-70.
doi: 10.1084/jem.20011911.

Polycomb group gene rae28 is required for sustaining activity of hematopoietic stem cells

Affiliations

Polycomb group gene rae28 is required for sustaining activity of hematopoietic stem cells

Hideaki Ohta et al. J Exp Med. .

Abstract

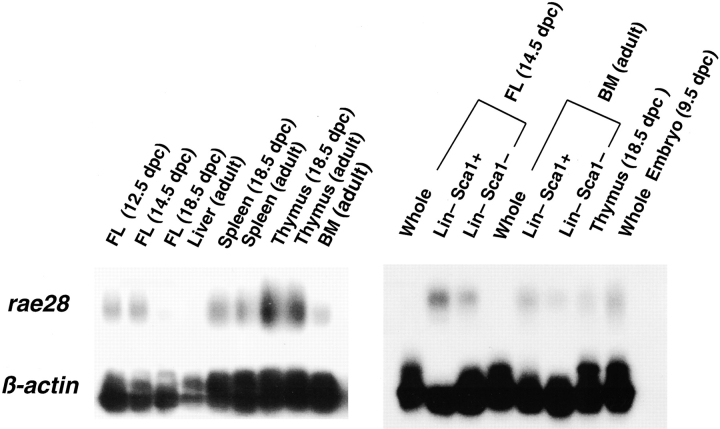
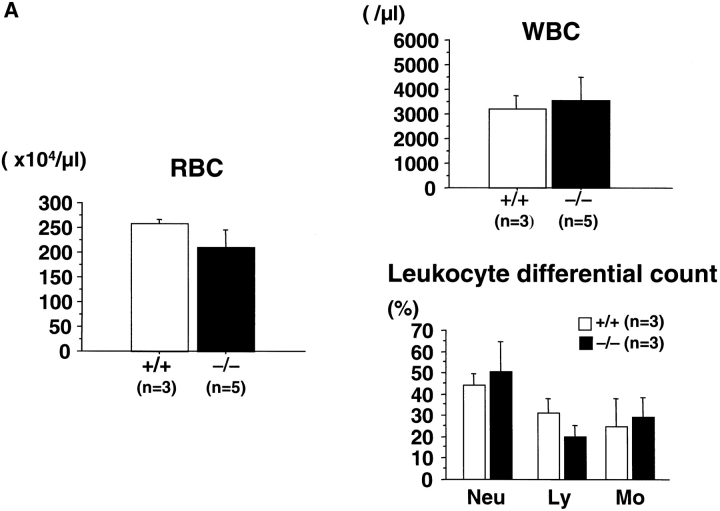
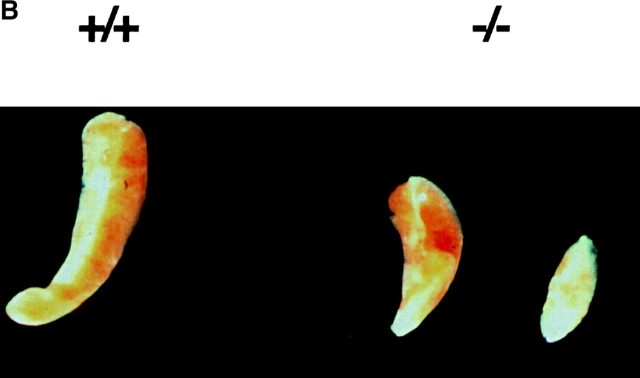
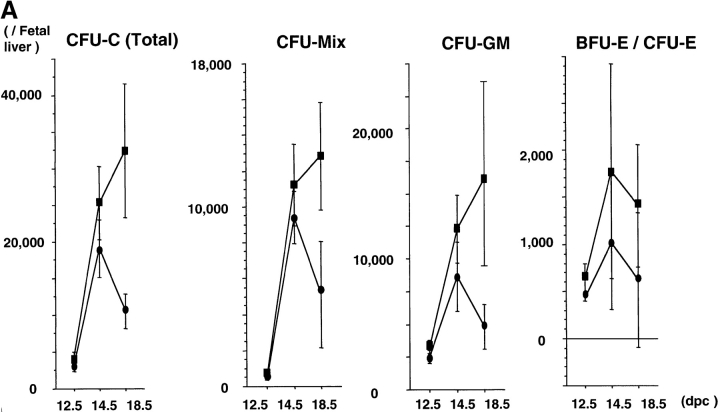
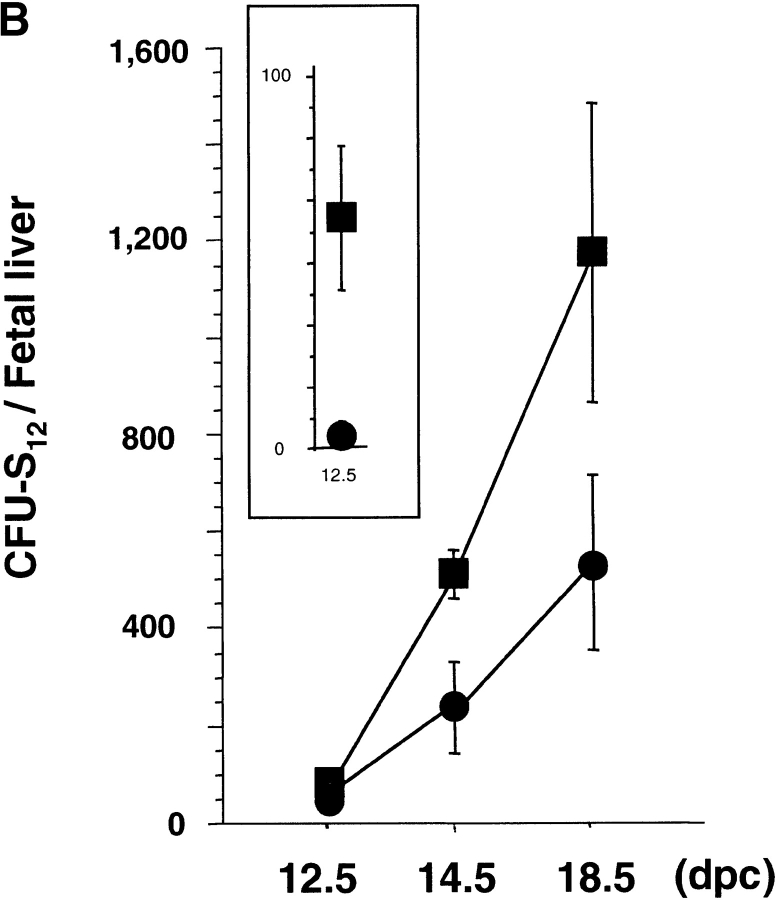
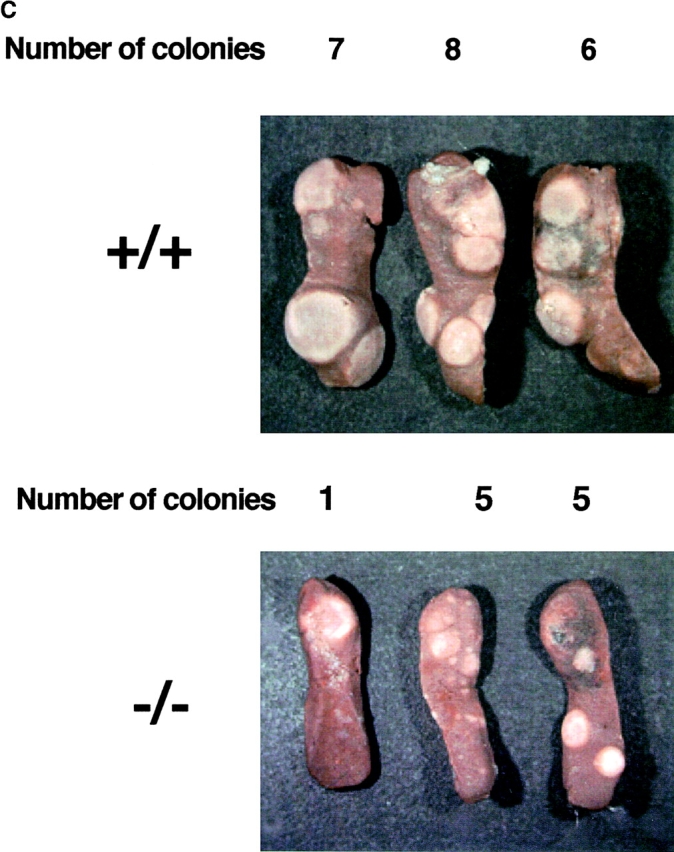
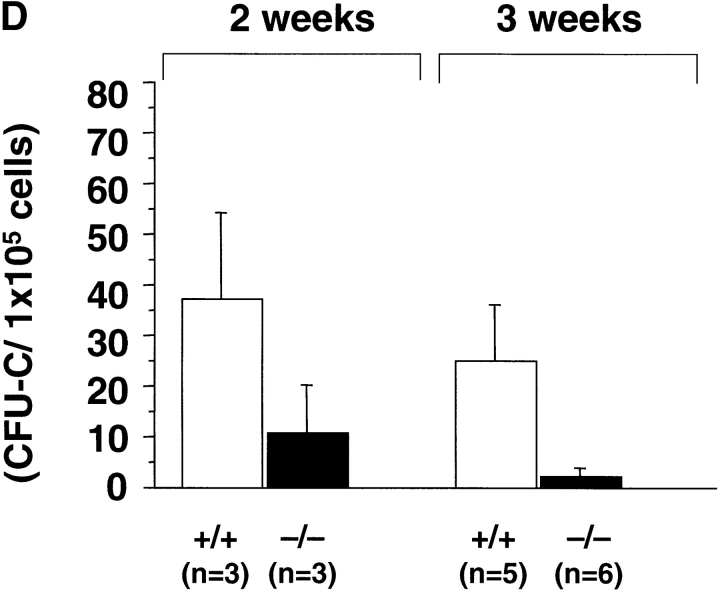
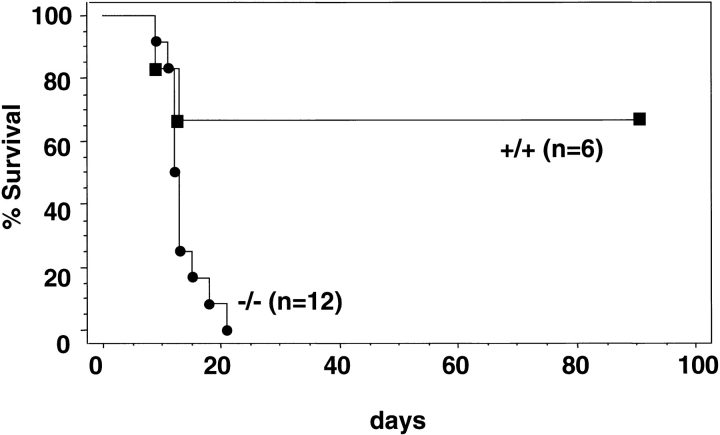
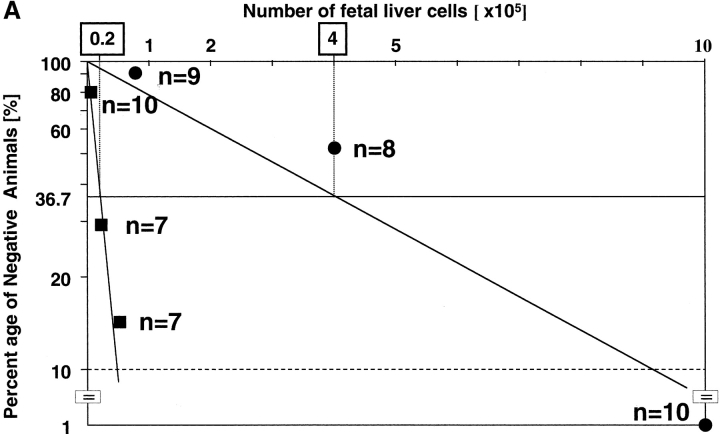
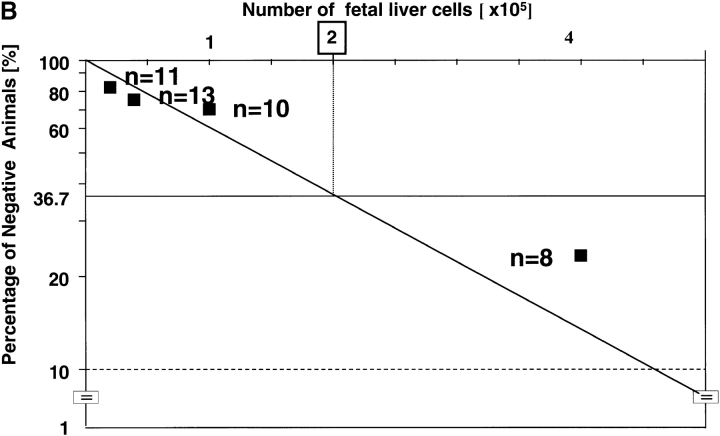
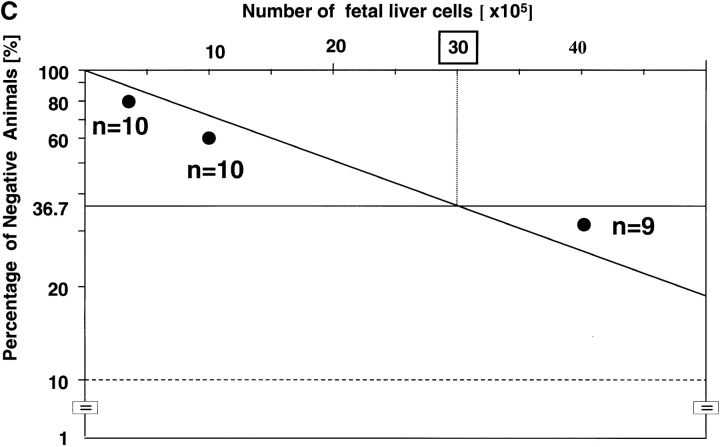
The rae28 gene (rae28), also designated as mph1, is a mammalian ortholog of the Drosophila polyhomeotic gene, a member of Polycomb group genes (PcG). rae28 constitutes PcG complex 1 for maintaining transcriptional states which have been once initiated, presumably through modulation of the chromatin structure. Hematopoietic activity was impaired in the fetal liver of rae28-deficient animals (rae28-/-), as demonstrated by progressive reduction of hematopoietic progenitors of multilineages and poor expansion of colony forming units in spleen (CFU-S(12)) during embryonic development. An in vitro long-term culture-initiating cell assay suggested a reduction in hematopoietic stem cells (HSCs), which was confirmed in vivo by reconstitution experiments in lethally irradiated congenic recipient mice. The competitive repopulating units (CRUs) reflect HSCs supporting multilineage blood-cell production. CRUs were generated, whereas the number of CRUs was reduced by a factor of 20 in the rae28-/- fetal liver. We also performed serial transplantation experiments to semiquantitatively measure self-renewal activity of CRUs in vivo. Self-renewal activity of CRUs was 15-fold decreased in rae28-/-. Thus the compromised HSCs were presumed to reduce hematopoietic activity in the rae28-/- fetal liver. This is the first report to suggest that rae28 has a crucial role in sustaining the activity of HSCs to maintain hematopoiesis.


Figures

Figure 1.
Figure 1.
Expression of rae28 in hematopoietic tissues and purified subpopulations of fetal liver and bone marrow cells. PCR-amplified total cDNAs were prepared from total RNAs extracted from the hematopoietic tissues and fractionated cells and were analyzed by Southern blot analysis with a rae28 probe. Note that high rae28 expression was detected in Lin, Sca-1+ subpopulations. BM, bone marrow; FL, fetal liver; Whole, whole fetal liver or bone marrow cells; Lin, Sca-1+, Lin, Sca-1+ subpopulations of fetal liver and bone marrow cells. Expression of β-actin is shown to confirm equal amount of cDNA on the filter.
Figure 2.
Figure 2.
Peripheral blood cells and the spleen. (A) Peripheral blood cell counts. The data represent mean values with a SD from at least three independent individuals. (B) Picture of spleen from +/+, wild-type and −/−, rae28 / mice.
Figure 2.
Figure 2.
Peripheral blood cells and the spleen. (A) Peripheral blood cell counts. The data represent mean values with a SD from at least three independent individuals. (B) Picture of spleen from +/+, wild-type and −/−, rae28 / mice.
Figure 3.
Figure 3.
(A) Expansion of CFU-Cs during embryonic development. The number of CFU-Cs in the embryonic fetal liver from 12.5 to 18.5 dpc was examined by methylcellulose assay. The data represent the mean number of CFU-Cs with a SD from at least five individuals. Both BFU-E and CFU-E are shown as erythroid colonies. Note that expansion of CFU-Cs including CFU-mix, CFU-GM, and BFU-E/CFU-E was progressively impaired in rae28 / embryos after 14.5 dpc. Black squares, wild-type; black circles, rae28 / . (B) Expansion of CFU-S12 during embryonic development. The data represent the mean of CFU-S12 colony numbers with a SD determined from a minimum of five recipients. The magnified panel shows the number of CFU-S12 in 12.5 dpc fetal liver cells. The number of CFU-S12 was already reduced at 12.5 dpc and its expansion during fetal development was also less effective in rae28 / . Black squares, wild-type; black circles, rae28 / . (C) Picture of CFU-S12 colonies. Fetal liver cells (4 × 10⁵) were injected to sublethally irradiated mice and the number of CFU-S12 was counted after fixation with Telleyesniczky's solution. The size as well as the number of CFU-S12 colonies was reduced in rae28 / . +/+, wild-type; −/−, rae28 / . (D) The number of LTC-IC in the 14.5 dpc fetal liver. Fetal liver cells were cultured 2 and 3 wk on S17 feeder layer cells and cultured cells were subjected to methylcellulose assay. The data represent the mean of CFU-C colony numbers with a SD determined from at least five individuals. The number is presumed to reflect the frequency and expansion of LTC-IC during the culture. Note that the reduction of LTC-IC was more severe in 3-wk culture than in 2-wk culture. White squares, wild-type; black squares, rae28 / .
Figure 3.
Figure 3.
(A) Expansion of CFU-Cs during embryonic development. The number of CFU-Cs in the embryonic fetal liver from 12.5 to 18.5 dpc was examined by methylcellulose assay. The data represent the mean number of CFU-Cs with a SD from at least five individuals. Both BFU-E and CFU-E are shown as erythroid colonies. Note that expansion of CFU-Cs including CFU-mix, CFU-GM, and BFU-E/CFU-E was progressively impaired in rae28 / embryos after 14.5 dpc. Black squares, wild-type; black circles, rae28 / . (B) Expansion of CFU-S12 during embryonic development. The data represent the mean of CFU-S12 colony numbers with a SD determined from a minimum of five recipients. The magnified panel shows the number of CFU-S12 in 12.5 dpc fetal liver cells. The number of CFU-S12 was already reduced at 12.5 dpc and its expansion during fetal development was also less effective in rae28 / . Black squares, wild-type; black circles, rae28 / . (C) Picture of CFU-S12 colonies. Fetal liver cells (4 × 10⁵) were injected to sublethally irradiated mice and the number of CFU-S12 was counted after fixation with Telleyesniczky's solution. The size as well as the number of CFU-S12 colonies was reduced in rae28 / . +/+, wild-type; −/−, rae28 / . (D) The number of LTC-IC in the 14.5 dpc fetal liver. Fetal liver cells were cultured 2 and 3 wk on S17 feeder layer cells and cultured cells were subjected to methylcellulose assay. The data represent the mean of CFU-C colony numbers with a SD determined from at least five individuals. The number is presumed to reflect the frequency and expansion of LTC-IC during the culture. Note that the reduction of LTC-IC was more severe in 3-wk culture than in 2-wk culture. White squares, wild-type; black squares, rae28 / .
Figure 4.
Figure 4.
Kaplan-Meier survival curve of lethally irradiated congenic mice transplanted with fetal liver cells. Fetal liver cells (4 × 10⁵) prepared from 14.5-dpc embryos were injected into congenic recipient mice and survival of the mice was investigated in the conventional facility. Black squares, wild-type; black circles, rae28 / .
Figure 5.
Figure 5.
Competitive repopulation assay. (A) Frequency of CRUs in the fetal liver. The peripheral blood cells in the congenic recipient mice injected with 14.5-dpc fetal liver cells were examined to assess the long-term reconstitution capacity of HSCs. 3 mo after transplantation, the proportion of mice exhibiting >1% EGFP+ cells was used to calculate the frequency of CRU. Black squares, wild-type; black circles, rae28 / (B and C) Serial transplantation experiments. Lethally irradiated recipient mice were injected with fetal liver cells including 20 CRUs, and 1 mo after injection frequency of CRUs in the primary recipient mice was determined by CRU assay. Frequency of CRUs derived from the wild-type and rae28 / cells was calculated from Figs. B and C, respectively. Note the number of injected cells shown in the top column of the figures is 10 times different between Figs. B and C.
Figure 5.
Figure 5.
Competitive repopulation assay. (A) Frequency of CRUs in the fetal liver. The peripheral blood cells in the congenic recipient mice injected with 14.5-dpc fetal liver cells were examined to assess the long-term reconstitution capacity of HSCs. 3 mo after transplantation, the proportion of mice exhibiting >1% EGFP+ cells was used to calculate the frequency of CRU. Black squares, wild-type; black circles, rae28 / (B and C) Serial transplantation experiments. Lethally irradiated recipient mice were injected with fetal liver cells including 20 CRUs, and 1 mo after injection frequency of CRUs in the primary recipient mice was determined by CRU assay. Frequency of CRUs derived from the wild-type and rae28 / cells was calculated from Figs. B and C, respectively. Note the number of injected cells shown in the top column of the figures is 10 times different between Figs. B and C.
Figure 6.
Figure 6.
Cell cycle status of fetal liver cells. Cells were pulse-labeled with 10 μg/ml BrdU after harvest, stained with PI, and subjected to FACS® analysis. Representative BrdU-FITC/PI fluorescence profiles of wild-type and rae28 / fetal liver cells are shown in the Figure. +/+, wild-type; −/−, rae28 / .
Figure 7.
Figure 7.
Expression of a- and b-clustered Hox genes (A) and genes for receptors, signaling molecules and transcription factors (B) involved in hematopoiesis. Expression of the p16, p19, and p21 genes were also shown in the Figure. PCR-amplified total cDNAs were prepared from 14.5 dpc fetal liver cells and expression of the genes was analyzed by Southern blot analysis. Expression of β-actin is shown as an internal marker to confirm the equal amount of cDNAs on the filter. +/+, wild-type; −/−, rae28 / .
Figure 7.
Figure 7.
Expression of a- and b-clustered Hox genes (A) and genes for receptors, signaling molecules and transcription factors (B) involved in hematopoiesis. Expression of the p16, p19, and p21 genes were also shown in the Figure. PCR-amplified total cDNAs were prepared from 14.5 dpc fetal liver cells and expression of the genes was analyzed by Southern blot analysis. Expression of β-actin is shown as an internal marker to confirm the equal amount of cDNAs on the filter. +/+, wild-type; −/−, rae28 / .

References

    1. Simon, J. 1995. Locking in stable states of gene expression: transcriptional control during Drosophila development. Curr. Opin. Cell Biol. 7:376–385. - PubMed
    1. Gould, A. 1997. Functions of mammalian Polycomb group and trithorax group related genes. Curr. Opin. Genet. Dev. 7:488–494. - PubMed
    1. Brock, H.W., and M. van Lohuizen. 2001. The polycomb group-no longer an exclusive club? Curr. Opin. Genet. Dev. 11:175–181. - PubMed
    1. Nomura, M., Y. Takihara, and K. Shimada. 1994. Isolation and characterization of retinoic acid-inducible cDNA clones in F9 cells: one of the early inducible clones encodes a novel protein sharing several highly homologous regions with a Drosophila polyhomeotic protein. Differentiation. 57:39–50. - PubMed
    1. Ohta, H., S. Tokimasa, Z. Zou, S. Funaki, H. Kurahashi, Y. Takahashi, M. Kimura, R. Matsuoka, M. Horie, J. Hara, et al. 2000. Structure and chromosomal localization of the RAE28/HPH1 gene, a human homologue of the polyhomeotic gene. DNA Seq. 11:61–73. - PubMed

Publication types

LinkOut - more resources