. 2002 Mar 18;195(6):771-80.
doi: 10.1084/jem.20011140.

B-1a B cells that link the innate and adaptive immune responses are lacking in the absence of the spleen

Affiliations

B-1a B cells that link the innate and adaptive immune responses are lacking in the absence of the spleen

Hedda Wardemann et al. J Exp Med. .

Abstract

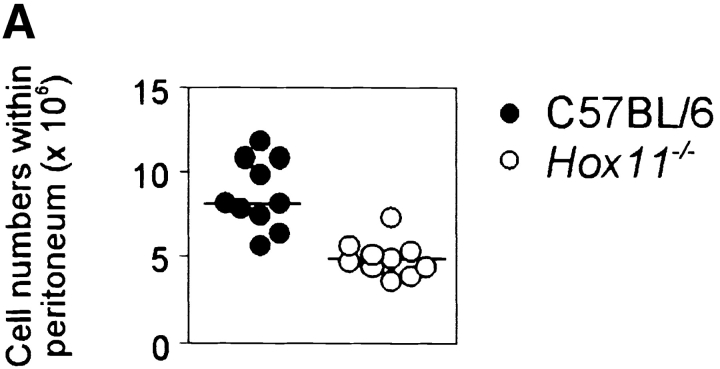
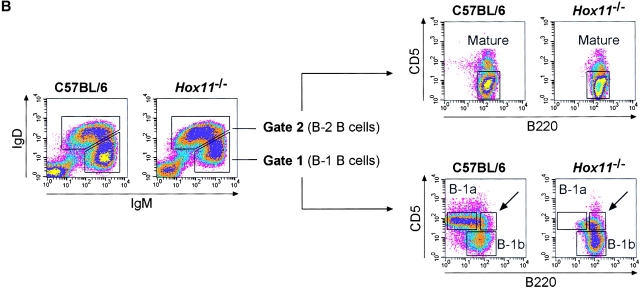
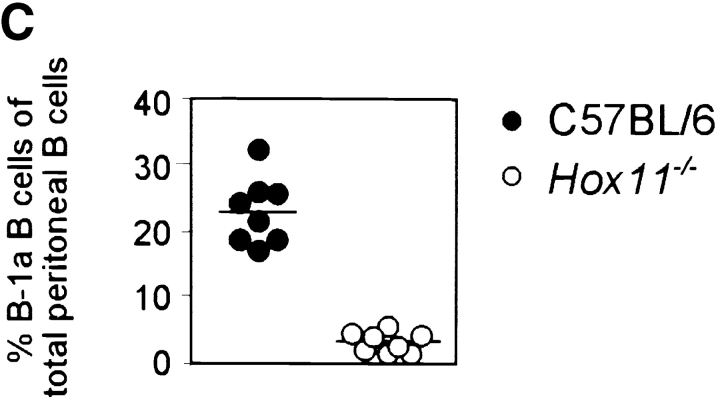
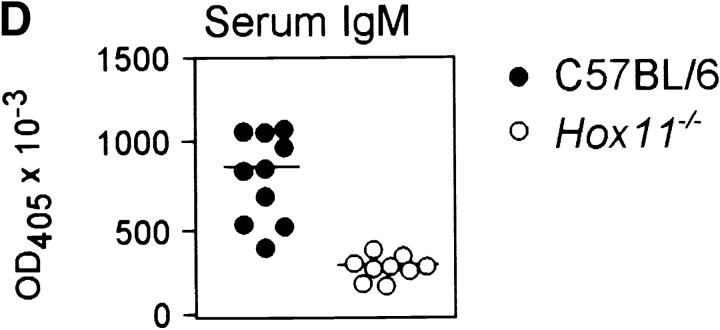
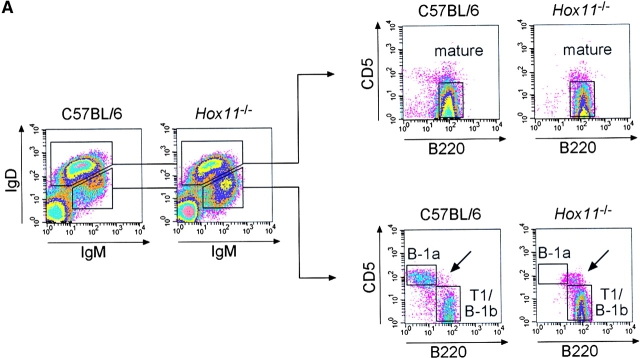
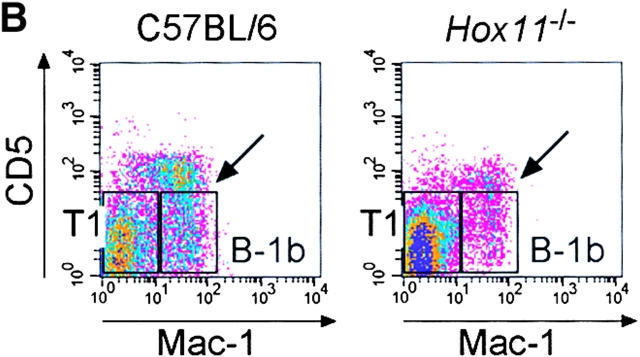
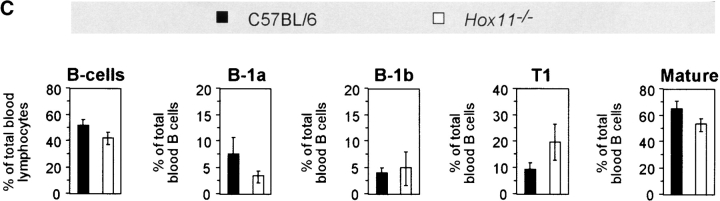
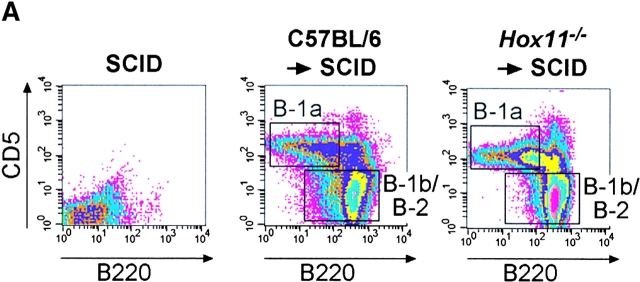
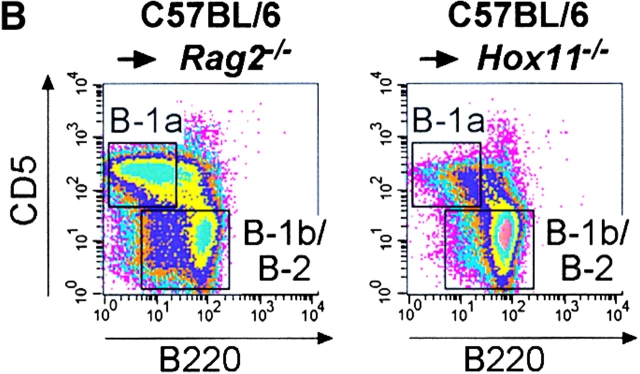
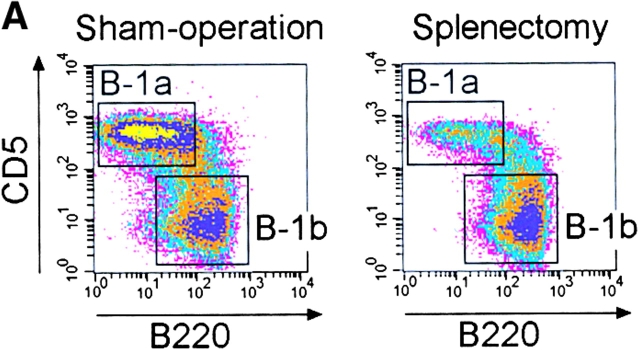
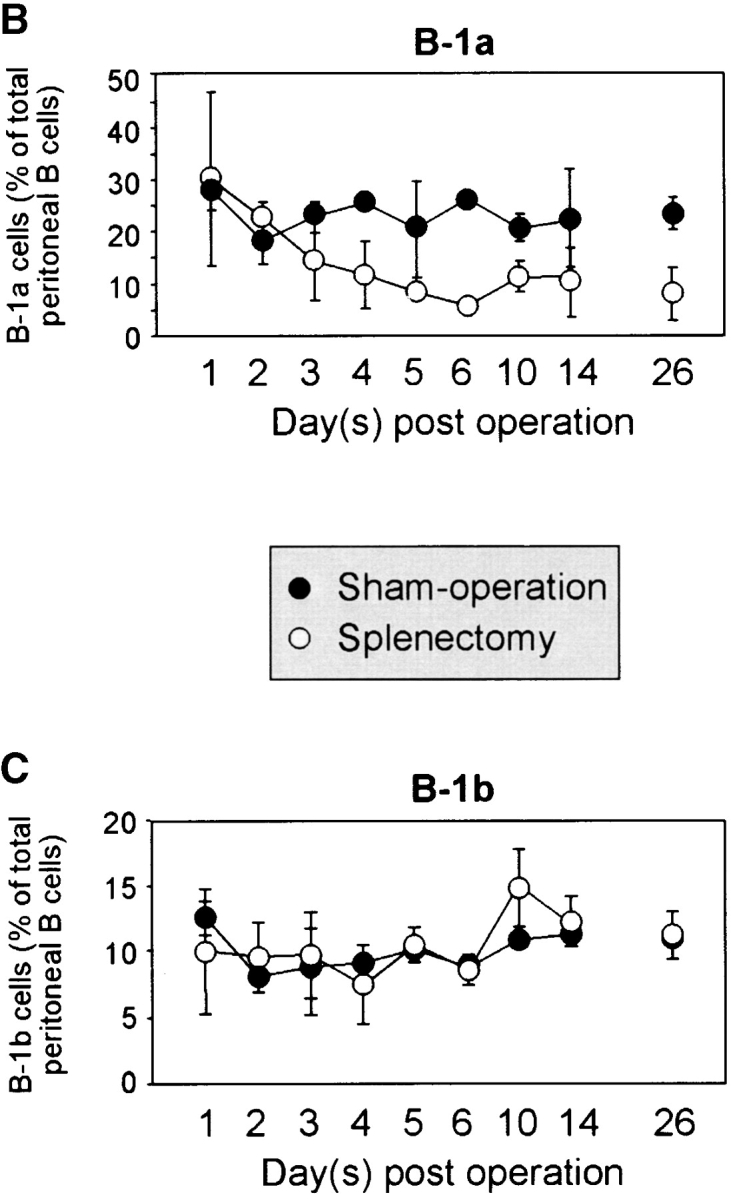
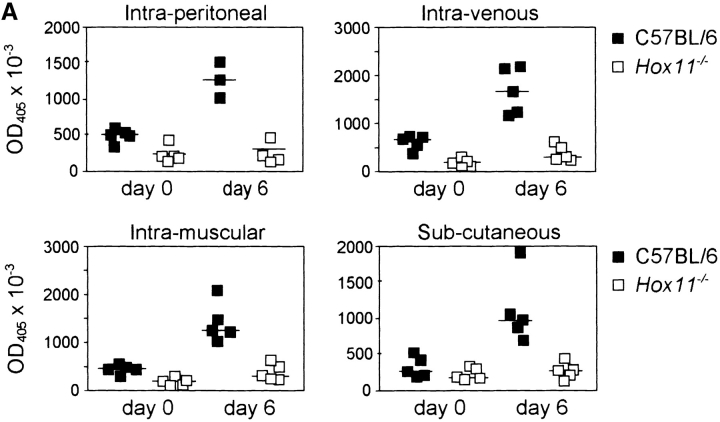
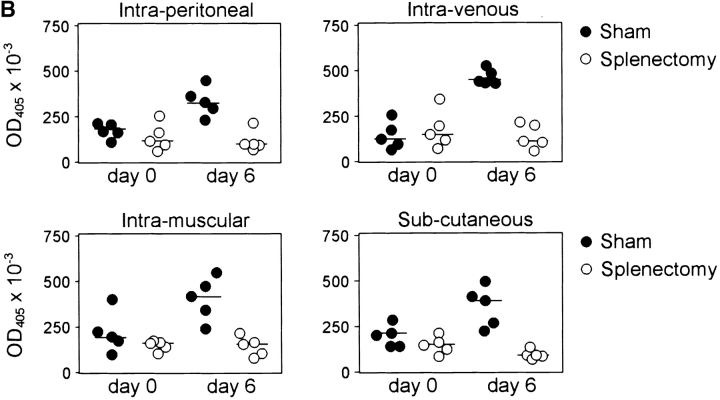
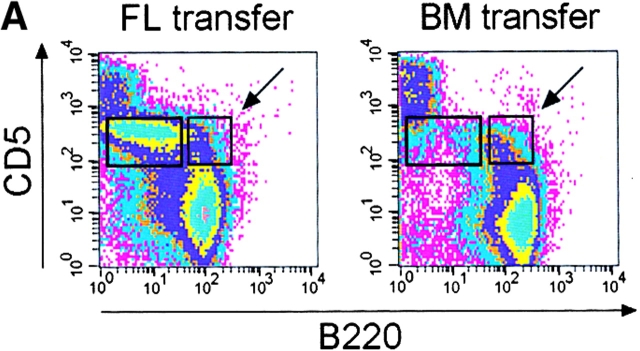
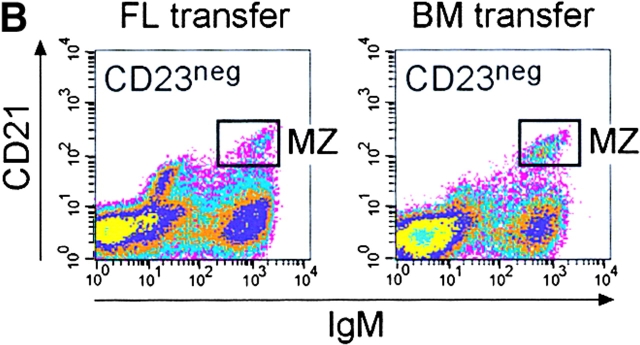
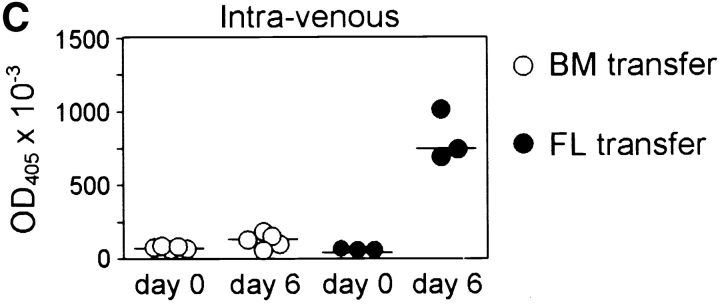
Splenectomized individuals are prone to overwhelming infections with encapsulated bacteria and splenectomy of mice increases susceptibility to streptococcal infections, yet the exact mechanism by which the spleen protects against such infections is unknown. Using congenitally asplenic mice as a model, we show that the spleen is essential for the generation of B-1a cells, a B cell population that cooperates with the innate immune system to control early bacterial and viral growth. Splenectomy of wild-type mice further demonstrated that the spleen is also important for the survival of B-1a cells. Transfer experiments demonstrate that lack of these cells, as opposed to the absence of the spleen per se, is associated with an inability to mount a rapid immune response against streptococcal polysaccharides. Thus, absence of the spleen and the associated increased susceptibility to streptococcal infections is correlated with lack of B-1a B cells. These findings reveal a hitherto unknown role of the spleen in generating and maintaining the B-1a B cell pool.


Figures

Figure 1.
Figure 1.
The spleen is important for the generation of peritoneal B-1a cells in the mouse. (A) The total number of peritoneal cells is shown for 16-wk-old C57BL/6 (n = 10) and Hox11-null (n = 10) mice. Hox11 +/− and C57BL/6 mice do not differ in any of the peritoneal B cell compartments; thus C57BL/6 were used as controls throughout the paper. (B) Peritoneal cavity cells of one C57BL/6 and one Hox11-null mouse were stained with antibodies against IgM, IgD, CD5, and B220 and analyzed by flow-cytometry. The relative expression of IgM and IgD can be used to discriminate IgMposIgDdull B-1 (gate 1) from IgMdullIgDpos B-2 cells (gate 2, left panels). Based on the expression of IgM and IgD, B-1 and B-2 cells were gated as indicated and analyzed for the expression of B220 and CD5 to further distinguish between CD5posB220dull B-1a cells (top region, bottom right panels) and the CD5negB220pos B-1b population (bottom region, bottom right panels). While B-1b cells are normal in Hox11-null mice, the B220dullCD5pos B-1a population is absent. B-2 cells (gate 2) are CD5negB220pos mature B cells (top right panels). The CD5posB220pos B-1a population that remains in Hox11-null mice is indicated with an arrow. (C) The proportion of B-1a cells in the peritoneum of C57BL/6 (n = 8) and Hox11-null (n = 8) are shown. Peritoneal B cells (IgMpos and/or IgDpos) were measured by flow cytometric analysis and IgMposIgDdullCD5posB220dull were classified as B-1a cells. (D) Relative serum IgM levels in blood of C57BL/6 (n = 10) and Hox11-null mice (n = 9) were determined by anti-IgM ELISA. Each data point represents the relative serum IgM level of one mouse measured at a 1:1,000 dilution.
Figure 1.
Figure 1.
The spleen is important for the generation of peritoneal B-1a cells in the mouse. (A) The total number of peritoneal cells is shown for 16-wk-old C57BL/6 (n = 10) and Hox11-null (n = 10) mice. Hox11 +/− and C57BL/6 mice do not differ in any of the peritoneal B cell compartments; thus C57BL/6 were used as controls throughout the paper. (B) Peritoneal cavity cells of one C57BL/6 and one Hox11-null mouse were stained with antibodies against IgM, IgD, CD5, and B220 and analyzed by flow-cytometry. The relative expression of IgM and IgD can be used to discriminate IgMposIgDdull B-1 (gate 1) from IgMdullIgDpos B-2 cells (gate 2, left panels). Based on the expression of IgM and IgD, B-1 and B-2 cells were gated as indicated and analyzed for the expression of B220 and CD5 to further distinguish between CD5posB220dull B-1a cells (top region, bottom right panels) and the CD5negB220pos B-1b population (bottom region, bottom right panels). While B-1b cells are normal in Hox11-null mice, the B220dullCD5pos B-1a population is absent. B-2 cells (gate 2) are CD5negB220pos mature B cells (top right panels). The CD5posB220pos B-1a population that remains in Hox11-null mice is indicated with an arrow. (C) The proportion of B-1a cells in the peritoneum of C57BL/6 (n = 8) and Hox11-null (n = 8) are shown. Peritoneal B cells (IgMpos and/or IgDpos) were measured by flow cytometric analysis and IgMposIgDdullCD5posB220dull were classified as B-1a cells. (D) Relative serum IgM levels in blood of C57BL/6 (n = 10) and Hox11-null mice (n = 9) were determined by anti-IgM ELISA. Each data point represents the relative serum IgM level of one mouse measured at a 1:1,000 dilution.
Figure 2.
Figure 2.
B-1a cells are absent in the blood of asplenic mice. (A) Representative flow cytometric analysis of peripheral blood cells isolated from C57BL/6 and Hox11-null mice. Cells were stained with antibodies against IgM, IgD, CD5, and B220. IgMdullIgDpos (left panels, top region) and IgMposIgDdull B lymphocytes (left panels, bottom region) were gated and analyzed for B220 versus CD5 expression (right panels). IgMdullIgDpos cells are B220posCD5neg mature B lymphocytes (top right panels). Gated IgMposIgDdull B lymphocytes (bottom right panels) comprise CD5posB220dull B-1a cells (top region) and CD5negB220pos B-1b and T1 cells (bottom region). The CD5posB220pos B-1a population that remains in Hox11-null mice is indicated with an arrow. (B) Representative flow cytometric analysis of cells stained with antibodies against IgM, IgD, CD5, and Mac-1 isolated from blood of the same C57BL/6 and Hox11-null mice analyzed in A. IgMposIgDdull B-lymphocytes were gated and analyzed for Mac-1 versus CD5 expression. Gated IgMposIgDdull B lymphocytes comprise CD5posMac-1pos B-1a cells (indicated by arrow), CD5negMac-1pos B-1b, and CD5negMac-1neg T1 cells. (C) Relative proportions of the major B cell populations in the peripheral blood of C57BL/6 and Hox11-null mice. Each value is the average of measurements obtained in five mice. For the purpose of measurement, B-1a cells are defined as IgMposIgDdullB220dullCD5pos, B-1b as IgMposIgDdullMac-1posCD5neg, and T1 as IgMposIgDdullMac-1negCD5neg. IgMposIgDdull cells constituted 26.5% ± 5.7% of total B cells (IgMpos and/or IgDpos) in the blood of C57BL/6 and 39.5% ± 6.5% in Hox11-null mice.
Figure 2.
Figure 2.
B-1a cells are absent in the blood of asplenic mice. (A) Representative flow cytometric analysis of peripheral blood cells isolated from C57BL/6 and Hox11-null mice. Cells were stained with antibodies against IgM, IgD, CD5, and B220. IgMdullIgDpos (left panels, top region) and IgMposIgDdull B lymphocytes (left panels, bottom region) were gated and analyzed for B220 versus CD5 expression (right panels). IgMdullIgDpos cells are B220posCD5neg mature B lymphocytes (top right panels). Gated IgMposIgDdull B lymphocytes (bottom right panels) comprise CD5posB220dull B-1a cells (top region) and CD5negB220pos B-1b and T1 cells (bottom region). The CD5posB220pos B-1a population that remains in Hox11-null mice is indicated with an arrow. (B) Representative flow cytometric analysis of cells stained with antibodies against IgM, IgD, CD5, and Mac-1 isolated from blood of the same C57BL/6 and Hox11-null mice analyzed in A. IgMposIgDdull B-lymphocytes were gated and analyzed for Mac-1 versus CD5 expression. Gated IgMposIgDdull B lymphocytes comprise CD5posMac-1pos B-1a cells (indicated by arrow), CD5negMac-1pos B-1b, and CD5negMac-1neg T1 cells. (C) Relative proportions of the major B cell populations in the peripheral blood of C57BL/6 and Hox11-null mice. Each value is the average of measurements obtained in five mice. For the purpose of measurement, B-1a cells are defined as IgMposIgDdullB220dullCD5pos, B-1b as IgMposIgDdullMac-1posCD5neg, and T1 as IgMposIgDdullMac-1negCD5neg. IgMposIgDdull cells constituted 26.5% ± 5.7% of total B cells (IgMpos and/or IgDpos) in the blood of C57BL/6 and 39.5% ± 6.5% in Hox11-null mice.
Figure 3.
Figure 3.
B-1a cells can be generated from Hox11-null fetal liver. (A) Fetal liver cells from C57BL/6 or Hox11-null mice were injected intravenously into irradiated SCID mice. 4 wk later peritoneal cavity cells of reconstituted mice were stained with antibodies against IgM, IgD, CD5, and B220. Data were analyzed by FACS® and compared with nonreconstituted SCID mice. B lymphocytes of reconstituted mice were gated based on IgM and/or IgD expression to remove non-B cells. (B) Fetal liver cells from C57BL/6 mice were injected intravenously into irradiated Rag2-null or Hox11-null mice. Peritoneal cells were analyzed 4 wk later as described in A.
Figure 3.
Figure 3.
B-1a cells can be generated from Hox11-null fetal liver. (A) Fetal liver cells from C57BL/6 or Hox11-null mice were injected intravenously into irradiated SCID mice. 4 wk later peritoneal cavity cells of reconstituted mice were stained with antibodies against IgM, IgD, CD5, and B220. Data were analyzed by FACS® and compared with nonreconstituted SCID mice. B lymphocytes of reconstituted mice were gated based on IgM and/or IgD expression to remove non-B cells. (B) Fetal liver cells from C57BL/6 mice were injected intravenously into irradiated Rag2-null or Hox11-null mice. Peritoneal cells were analyzed 4 wk later as described in A.
Figure 4.
Figure 4.
The peritoneal B-1a cell pool is rapidly reduced following splenectomy. (A) Representative FACS® analysis of peritoneal B cells isolated 10 d after splenectomy or sham operation and gated for IgMposMac-1pos cells. A reduction of the CD5posB220dull B-1a population can be seen. (B) Time course of reduction in B-1a cells upon splenectomy. C57BL/6 mice were either splenectomized or sham-operated and the frequency of B220dullCD5posIgMposMac-1pos B-1a cells determined by flow-cytometry at the indicated time points after surgery. At least three splenectomized and two sham-operated mice were examined for each time point, except for sham-operated day 6 where the cell number from only one mouse is shown. (C) Similar time course for B220posCD5negIgMposMac-1pos B-1b cells.
Figure 4.
Figure 4.
The peritoneal B-1a cell pool is rapidly reduced following splenectomy. (A) Representative FACS® analysis of peritoneal B cells isolated 10 d after splenectomy or sham operation and gated for IgMposMac-1pos cells. A reduction of the CD5posB220dull B-1a population can be seen. (B) Time course of reduction in B-1a cells upon splenectomy. C57BL/6 mice were either splenectomized or sham-operated and the frequency of B220dullCD5posIgMposMac-1pos B-1a cells determined by flow-cytometry at the indicated time points after surgery. At least three splenectomized and two sham-operated mice were examined for each time point, except for sham-operated day 6 where the cell number from only one mouse is shown. (C) Similar time course for B220posCD5negIgMposMac-1pos B-1b cells.
Figure 5.
Figure 5.
Hox11-null and splenectomized mice do not respond to vaccination with streptococcal polysaccharides. Pneumovax® 23 was injected subcutaneously, intramuscularly, intraperitoneally, or intravenously into either (A) C57BL/6 and Hox11-null mice or (B) sham-operated and splenectomized mice. Specific IgM antibodies in sera were measured by ELISA before and 6 d after immunization. The optical density (OD405) measured with a 1:80 serum dilution is shown. Each data point indicates the relative antibody level of a single mouse.
Figure 5.
Figure 5.
Hox11-null and splenectomized mice do not respond to vaccination with streptococcal polysaccharides. Pneumovax® 23 was injected subcutaneously, intramuscularly, intraperitoneally, or intravenously into either (A) C57BL/6 and Hox11-null mice or (B) sham-operated and splenectomized mice. Specific IgM antibodies in sera were measured by ELISA before and 6 d after immunization. The optical density (OD405) measured with a 1:80 serum dilution is shown. Each data point indicates the relative antibody level of a single mouse.
Figure 6.
Figure 6.
Mice lacking B-1a cells but possessing a spleen fail to respond to immunization with streptococcal polysaccharides. (A) Fetal liver (FL) or bone marrow (BM) cells from C57BL/6 mice were injected intraperitoneally into irradiated Rag2-null mice and four weeks later reconstituted mice were analyzed. A representative FACS® analysis of total ungated peritoneal cells stained for CD5 and B220 from a FL- and a BM-transferred mouse is shown above. The CD5posB220dull B-1a cell population is boxed. The CD5posB220pos B cells phenotypically identical to residual CD5pos B cells of Hox11-null mice are indicated by a box and arrow. (B) Representative FACS® analyses of CD23neg-gated spleen cells stained for CD21 and IgM from a FL- and a BM-transferred mouse are shown. The normal position of the MZ B cell population (MZ) is boxed. (C) Specific IgM antibodies in sera of transferred mice. Pneumovax® 23 was injected intraperitoneally 20 d after transfer. Antibodies were measured by ELISA 1 d before and 6 d after Pneumovax® 23 injection. The optical density (OD405) measured with a 1:80 serum dilution is shown. Each data point indicates the relative antibody level of a single mouse. (D) The response to Pneumovax® 23 of mice transferred with either bone marrow (BM) or dE14.5 fetal liver cells (FL) is shown as mean fold-increase of specific serum IgM as detected by ELISA. The optical density (OD405) was measured with a 1:80 serum dilution. For each route of injection, five mice were transferred with bone marrow and three with fetal liver cells.
Figure 6.
Figure 6.
Mice lacking B-1a cells but possessing a spleen fail to respond to immunization with streptococcal polysaccharides. (A) Fetal liver (FL) or bone marrow (BM) cells from C57BL/6 mice were injected intraperitoneally into irradiated Rag2-null mice and four weeks later reconstituted mice were analyzed. A representative FACS® analysis of total ungated peritoneal cells stained for CD5 and B220 from a FL- and a BM-transferred mouse is shown above. The CD5posB220dull B-1a cell population is boxed. The CD5posB220pos B cells phenotypically identical to residual CD5pos B cells of Hox11-null mice are indicated by a box and arrow. (B) Representative FACS® analyses of CD23neg-gated spleen cells stained for CD21 and IgM from a FL- and a BM-transferred mouse are shown. The normal position of the MZ B cell population (MZ) is boxed. (C) Specific IgM antibodies in sera of transferred mice. Pneumovax® 23 was injected intraperitoneally 20 d after transfer. Antibodies were measured by ELISA 1 d before and 6 d after Pneumovax® 23 injection. The optical density (OD405) measured with a 1:80 serum dilution is shown. Each data point indicates the relative antibody level of a single mouse. (D) The response to Pneumovax® 23 of mice transferred with either bone marrow (BM) or dE14.5 fetal liver cells (FL) is shown as mean fold-increase of specific serum IgM as detected by ELISA. The optical density (OD405) was measured with a 1:80 serum dilution. For each route of injection, five mice were transferred with bone marrow and three with fetal liver cells.

References

    1. Hansen, K., and D.B. Singer. 2001. Asplenic-hyposplenic overwhelming sepsis: postsplenectomy sepsis revisited. Ped. Dev. Pathol. 4:105–121. - PubMed
    1. Styrt, B. 1990. Infection associated with asplenia: risks, mechanisms, and prevention. Am. J. Med. 88:33N–42N. - PubMed
    1. Phoon, C.K., and C.A. Neill. 1994. Asplenia syndrome: insight into embryology through an analysis of cardiac and extracardiac anomalies. Am. J. Cardiol. 73:581–587. - PubMed
    1. Feder, H.M., Jr., and H.A. Pearson. 1999. Assessment of splenic function in familial asplenia. N. Engl. J. Med. 341:210–212. - PubMed
    1. Germing, U., C. Perings, S. Steiner, A.J. Peters, M.P. Heintzen, and C. Aul. 1999. Congenital asplenia detected in a 60 year old patient with septicemia. Eur. J. Med. Res. 28:283–285. - PubMed