. 2002 Mar 19;99(6):3370-5.
doi: 10.1073/pnas.052545099.

Fast 100-nm resolution three-dimensional microscope reveals structural plasticity of mitochondria in live yeast

Affiliations

Fast 100-nm resolution three-dimensional microscope reveals structural plasticity of mitochondria in live yeast

Alexander Egner et al. Proc Natl Acad Sci U S A. .

Abstract

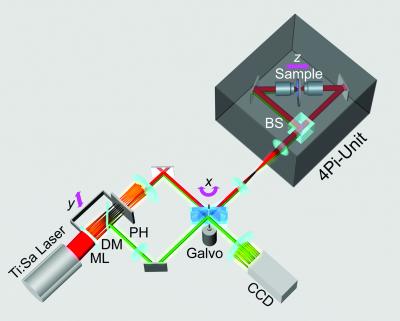
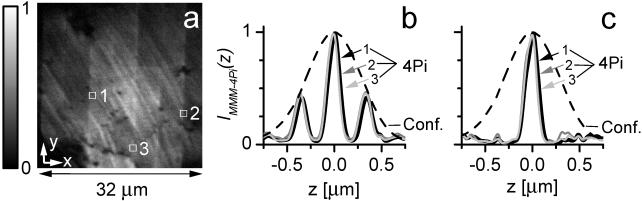
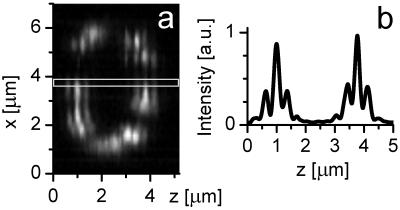
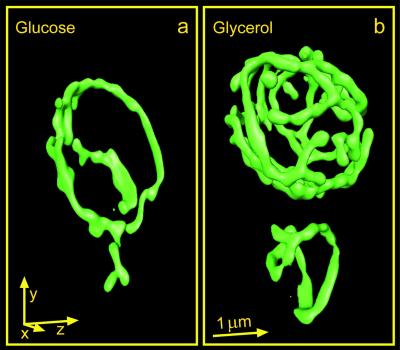
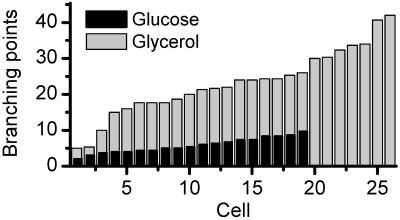
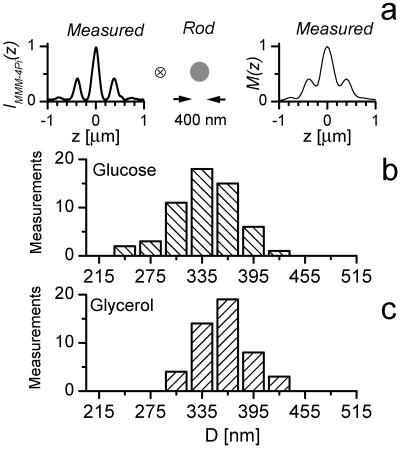
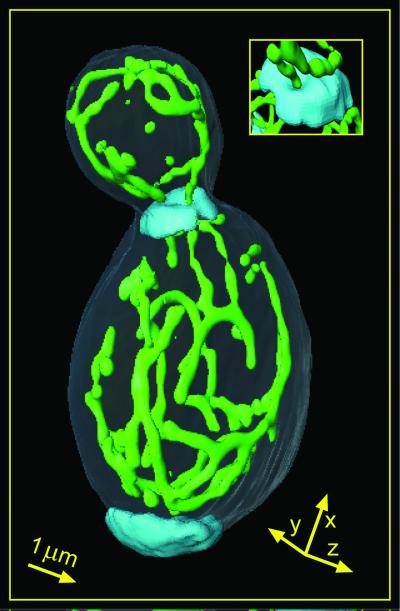
By introducing beam-scanning multifocal multiphoton 4Pi-confocal microscopy, we have attained fast fluorescence imaging of live cells with axial super resolution. Rapid scanning of up to 64 pairs of interfering high-angle fields and subsequent confocal detection enabled us to perform three to five times finer optical sectioning than confocal microscopy. In conjunction with nonlinear image restoration, we demonstrate, to our knowledge for the first time, three-dimensional imaging of live eukaryotic cells at an equilateral resolution of approximately 100 nm. This imaging mode allowed us to reveal the morphology and size of the green fluorescent protein-labeled mitochondrial compartment of live Saccharomyces cerevisiae (bakers' yeast) growing on different carbon sources. Our studies show that mitochondria of cells grown on medium containing glycerol as the only carbon source, as opposed to glucose-grown cells, exhibit a strongly branched tubular reticulum. We determine the average tubular diameter and find that it increases from 339 +/- 5 nm to 360 +/- 4 nm when changing from glucose to glycerol, that is, from a fermentable to a nonfermentable carbon source. Moreover, this change is associated with a 2.8-fold increase of the surface of the reticulum, resulting in an average increase in volume of the mitochondrial compartment by a factor of 3.0 +/- 0.2.


Figures

Figure 1
Figure 1
MMM-4Pi setup. An array of microlenses (ML) splits a pulsed laser beam into an array of beamlets, focused onto a pinhole (PH) array. After being cleaned by the pinholes, the beamlets are deflected by a scan mirror and directed to the 4Pi head, where an array of counterpropagating illumination foci is produced inside the specimen by using a beam splitter (BS). The array of fluorescence spots is imaged by the left objective lens back onto the pinhole array. The spatially filtered fluorescence is separated from the laser light by a dichroic mirror (DM) and scanned across the charge-coupled device camera by the back side of the mirror. Axial (z) scanning is accomplished by moving the specimen. Scanning in the y direction is performed by translating the linked pinhole and microlens arrays.
Figure 2
Figure 2
xy image of a fluorescent monolayer taken from a 3D stack (a). Axial intensity profiles through the 3D stack, IMMM-4Pi(z), exhibiting a sharp maximum and two lobes, recorded at three different coordinates (x,y) (b). The spatial invariance of the three profiles, IMMM-4Pi(z), indicates that the 4Pi-confocal PSF is constant over the whole field of view, irrespective of the microlens used. Fast linear one-step deconvolution can be applied throughout the field of view to remove the side lobes (c).
Figure 3
Figure 3
Raw data of an xz image (a) through a yeast cell with GFP targeted to the mitochondrial matrix and a representative intensity profile along the optic axis (b).
Figure 4
Figure 4
GFP-labeled mitochondrial compartment of live S. cerevisiae (strain BY4743) recorded with the MMM-4Pi and displayed as surface-rendered 3D data. a and b show cells grown in complete medium with glucose or glycerol as the sole carbon source, respectively. An arrow corresponds to 1 μm in the respective direction.
Figure 5
Figure 5
Number of branch points within the mitochondrial network for the glucose- (black) and glycerol- (gray) grown cells, featuring 5.8 ± 2.1 and 23.0 ± 9.3 branch points, respectively.
Figure 6
Figure 6
Axial intensity profile through a mitochondrion M(z) exhibits elevated minima as a result of their finite diameter D. M(z) is represented by the convolution of a thin-layer response IMMM-4Pi(z) with a rod of diameter D, as sketched in a. Note that both M(z) and IMMM-4Pi(z) are measured data derived from a 3D image. Deconvolution analysis of the glucose- (b) and glycerol- (c) grown yeast cells reveals that in b, the average diameter is 339 ± 5 nm, whereas in c it is 360 ± 4 nm.
Figure 7
Figure 7
S. cerevisiae with GFP-targeted mitochondrial matrix, grown on YPGlycerol. Displayed is a surface-rendered 3D-data stack of the mitochondrial network recorded with the MMM-4Pi. The cell wall and bud scars have been separately stained with the dye calcofluor white. The bud scars are volume rendered, whereas the visualization of the cell wall was performed by interactive contour tracing. The length of each arrow corresponds to 1 μm. (Inset) Magnification of the budding site from a different perspective. A mitochondrial tubule crosses the budding site through a channel in the bud scar (see Movie 1).

References

    1. Pawley J. Handbook of Biological Confocal Microscopy. New York: Plenum; 1995.
    1. Goodman J W. Introduction to Fourier Optics. New York: Mc Graw–Hill; 1968.
    1. Hell S W, Stelzer E H K. Opt Commun. 1992;93:277–282.
    1. Hell S W, Wichmann J. Opt Lett. 1994;19:780–782. - PubMed
    1. Klar T A, Jakobs S, Dyba M, Egner A, Hell S W. Proc Natl Acad Sc USA. 2000;97:8206–8210. - PMC - PubMed

Publication types

LinkOut - more resources