

Preferential maintenance of critically short telomeres in mammalian cells heterozygous for mTert
- PMID: 11904422
- PMCID: PMC122569
- DOI: 10.1073/pnas.062549199
Preferential maintenance of critically short telomeres in mammalian cells heterozygous for mTert
Abstract
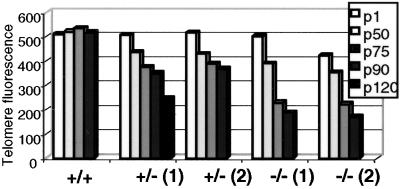
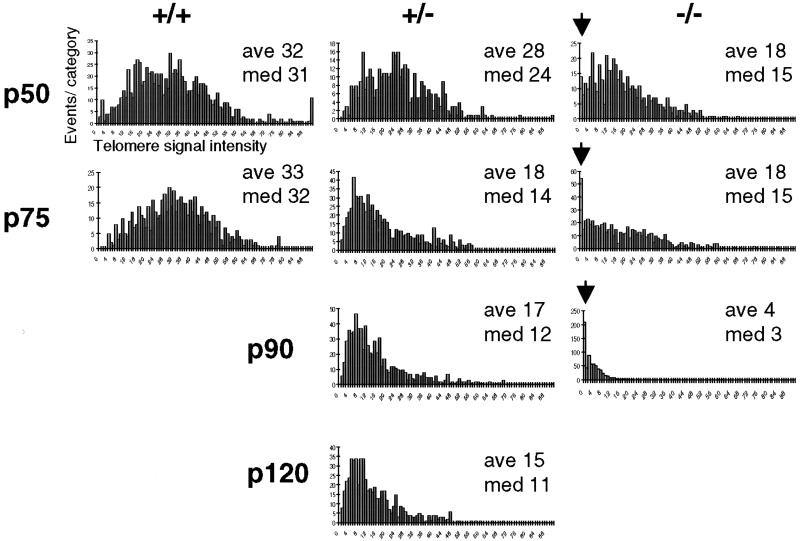
Prolonged growth of murine embryonic stem (ES) cells lacking the telomerase reverse transcriptase, mTert, results in a loss of telomere DNA and an increased incidence of end-to-end fusions and aneuploidy. Furthermore, loss of only one copy of mTert also results in telomere shortening intermediate between wild-type (wt) and mTert-null ES cells [Liu, Y., Snow, B. E., Hande, M. P., Yeung, D., Erdmann, N. J., Wakeham, A., Itie, A., Siderovski, D. P., Lansdorp, P. M., Robinson, M. O. & Harrington, L. (2000) Curr. Biol. 10, 1459-1462]. Unexpectedly, although average telomere length in mTert(+/-) ES cells declined to a similar level as mTert-null ES cells, mTert(+/-) ES cell lines retained a minimal telomeric DNA signal at all chromosome ends. Consequently, no end-to-end fusions and genome instability were observed in the latest passages of mTert(+/-) ES cell lines. These data uncover a functional distinction between the dosage-dependent function of telomerase in average telomere-length maintenance and the selective maintenance of critically short telomeres in cells heterozygous for mTert. In normal and tumor cells, we suggest that telomerase activity insufficient to maintain a given average telomere length may, nonetheless, provide a protective advantage from end-to-end fusion and genome instability.
Figures


Similar articles
-
An increase in telomere sister chromatid exchange in murine embryonic stem cells possessing critically shortened telomeres.Proc Natl Acad Sci U S A. 2005 Jul 19;102(29):10256-60. doi: 10.1073/pnas.0504635102. Epub 2005 Jul 6. Proc Natl Acad Sci U S A. 2005. PMID: 16000404 Free PMC article.
-
An intact putative mouse telomerase essential N-terminal domain is necessary for proper telomere maintenance.Biol Cell. 2016 Apr;108(4):96-112. doi: 10.1111/boc.201500089. Epub 2016 Feb 18. Biol Cell. 2016. PMID: 26787169
-
Telomeric function of mammalian telomerases at short telomeres.J Cell Sci. 2010 May 15;123(Pt 10):1693-704. doi: 10.1242/jcs.063636. Epub 2010 Apr 27. J Cell Sci. 2010. PMID: 20427319
-
The role of telomeres and telomerase complex in haematological neoplasia: the length of telomeres as a marker of carcinogenesis and prognosis of disease.Prague Med Rep. 2010;111(2):91-105. Prague Med Rep. 2010. PMID: 20653999 Review.
-
Telomere and telomerase in stem cells: relevance in ageing and disease.Front Biosci (Schol Ed). 2012 Jan 1;4(1):16-30. doi: 10.2741/248. Front Biosci (Schol Ed). 2012. PMID: 22202040 Review.
Cited by
-
Telomere shortening occurs early during breast tumorigenesis: a cause of chromosome destabilization underlying malignant transformation?J Mammary Gland Biol Neoplasia. 2004 Jul;9(3):285-96. doi: 10.1023/B:JOMG.0000048775.04140.92. J Mammary Gland Biol Neoplasia. 2004. PMID: 15557801 Review.
-
Two RNA subunits and POT1a are components of Arabidopsis telomerase.Proc Natl Acad Sci U S A. 2011 Jan 4;108(1):73-78. doi: 10.1073/pnas.1013021107. Epub 2010 Dec 16. Proc Natl Acad Sci U S A. 2011. Retraction in: Proc Natl Acad Sci U S A. 2019 Dec 3;116(49):24908. doi: 10.1073/pnas.1918863116. PMID: 21164032 Free PMC article. Retracted.
-
Induction of nitric oxide synthase-dependent telomere shortening after functional inhibition of Hsp90 in human tumor cells.Mol Cell Biol. 2006 Feb;26(4):1452-62. doi: 10.1128/MCB.26.4.1452-1462.2006. Mol Cell Biol. 2006. PMID: 16449656 Free PMC article.
-
Fluorescence spectroscopic detection and measurement of single telomere molecules.Nucleic Acids Res. 2018 Nov 2;46(19):e117. doi: 10.1093/nar/gky627. Nucleic Acids Res. 2018. PMID: 30010842 Free PMC article.
-
Length regulation and dynamics of individual telomere tracts in wild-type Arabidopsis.Plant Cell. 2004 Aug;16(8):1959-67. doi: 10.1105/tpc.104.023093. Epub 2004 Jul 16. Plant Cell. 2004. PMID: 15258263 Free PMC article.
References
-
- Nugent C I, Lundblad V. Genes Dev. 1998;12:1073–1085. - PubMed
-
- Nakamura T M, Morin G B, Chapman K B, Weinrich S L, Andrews W H, Lingner J, Harley C B, Cech T R. Science. 1997;277:955–959. - PubMed
-
- Blasco M A, Lee H W, Hande M P, Samper E, Lansdorp P M, DePinho R A, Greider C W. Cell. 1997;91:25–34. - PubMed
-
- Singer M S, Gottschling D E. Science. 1994;266:404–409. - PubMed
Publication types
MeSH terms
Substances
Grants and funding
LinkOut - more resources
Full Text Sources
Molecular Biology Databases
