. 2002 Mar 19;99(6):3695-700.
doi: 10.1073/pnas.062526999.

Metabolic efficiency and amino acid composition in the proteomes of Escherichia coli and Bacillus subtilis

Affiliations

Metabolic efficiency and amino acid composition in the proteomes of Escherichia coli and Bacillus subtilis

Hiroshi Akashi et al. Proc Natl Acad Sci U S A. .

Abstract

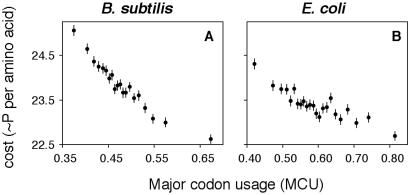
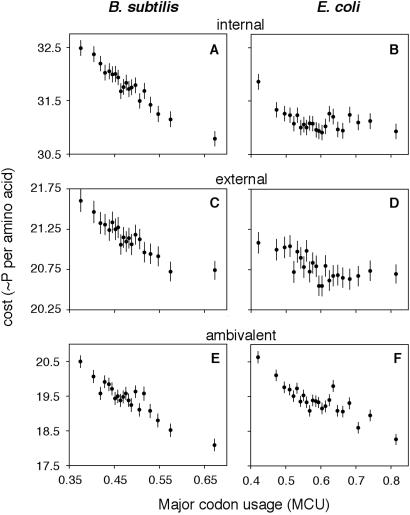
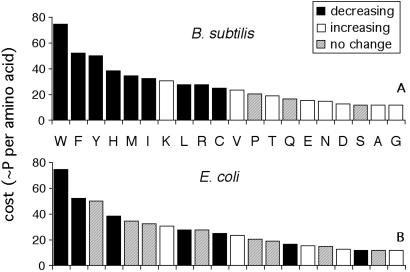
Biosynthesis of an Escherichia coli cell, with organic compounds as sources of energy and carbon, requires approximately 20 to 60 billion high-energy phosphate bonds [Stouthamer, A. H. (1973) Antonie van Leeuwenhoek 39, 545-565]. A substantial fraction of this energy budget is devoted to biosynthesis of amino acids, the building blocks of proteins. The fueling reactions of central metabolism provide precursor metabolites for synthesis of the 20 amino acids incorporated into proteins. Thus, synthesis of an amino acid entails a dual cost: energy is lost by diverting chemical intermediates from fueling reactions and additional energy is required to convert precursor metabolites to amino acids. Among amino acids, costs of synthesis vary from 12 to 74 high-energy phosphate bonds per molecule. The energetic advantage to encoding a less costly amino acid in a highly expressed gene can be greater than 0.025% of the total energy budget. Here, we provide evidence that amino acid composition in the proteomes of E. coli and Bacillus subtilis reflects the action of natural selection to enhance metabolic efficiency. We employ synonymous codon usage bias as a measure of translation rates and show increases in the abundance of less energetically costly amino acids in highly expressed proteins.


Figures

Figure 1
Figure 1
Fueling reactions and amino acid biosynthetic pathways in E. coli. Fueling reactions and amino acid biosynthetic pathways are shown as black and blue arrows, respectively. Abbreviations for precursor metabolites are given in Table 1. The numbers of arrows do not reflect the numbers of steps in the biosynthetic pathways. The major anapleurotic pathway, which replenishes oxaloacetate (oaa) in the tricarboxylic acid (TCA) cycle, is shown in yellow.
Figure 2
Figure 2
Correlations between energetic costs and MCU in B. subtilis (A) and E. coli (B) genes. The average cost per amino acid is plotted against average MCU for bins of genes. Genes were ranked by MCU and data were pooled from low to high MCU values until 50,000 codons was reached for each bin. Data for the highest MCU class were pooled with the second highest class if the remaining number of codons was less than 25,000. Bars indicate 95% confidence intervals on the estimates of mean costs. The bin size was chosen to be 50,000 codons so that data could be compared for at least 20 points.
Figure 3
Figure 3
Correlations between energetic costs and codon bias within physicochemical categories of amino acids. Average cost per amino acid was calculated among amino acids that tend to be found in internal, or non-solvent-exposed (F, L, I, M, V) and external, or solvent-exposed (H, R, K, Q, E, N, D) regions of proteins. Amino acids that function in both categories are classified as ambivalent (W, Y, C, A, S, G, P, T). Data are shown for MCU bins as described in the legend of Fig. 2. See Table 1 for one-letter amino acid symbols.
Figure 4
Figure 4
Changes in amino acid composition with codon bias in B. subtilis and E. coli. Amino acids that show a statistically significant change in abundance with major codon usage are shown for B. subtilis (Upper) and E. coli (Lower). The amino acids are arranged in order of decreasing metabolic cost. Only amino acids that showed a statistically significant change in both the full gene data set and across functional categories (Table 4) were classified as increasing or decreasing. See Table 1 for one-letter amino acid symbols.

Similar articles

Cited by

References

    1. Richmond R C. Nature (London) 1970;225:1025–1028. - PubMed
    1. King J L, Jukes T H. Science. 1969;164:788–797. - PubMed
    1. Doolittle R F. In: The Proteins. 3rd Ed. Neurath H, Hill R L, editors. Vol. 4. New York: Academic; 1979. pp. 1–118.
    1. Li W-H. Molecular Evolution. Sunderland, MA: Sinauer; 1997. pp. 185–190.
    1. Sueoka N. Cold Spring Harbor Symp Quant Biol. 1961;26:35–43. - PubMed

Publication types

MeSH terms

LinkOut - more resources