. 2002 Mar 19;99(6):4002-7.
doi: 10.1073/pnas.062057099.

Induction of behavioral associative memory by stimulation of the nucleus basalis

Affiliations

Induction of behavioral associative memory by stimulation of the nucleus basalis

Dewey E McLin 3rd et al. Proc Natl Acad Sci U S A. .

Abstract

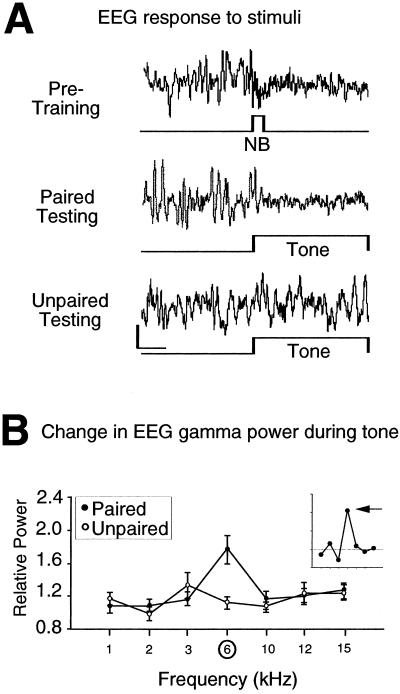
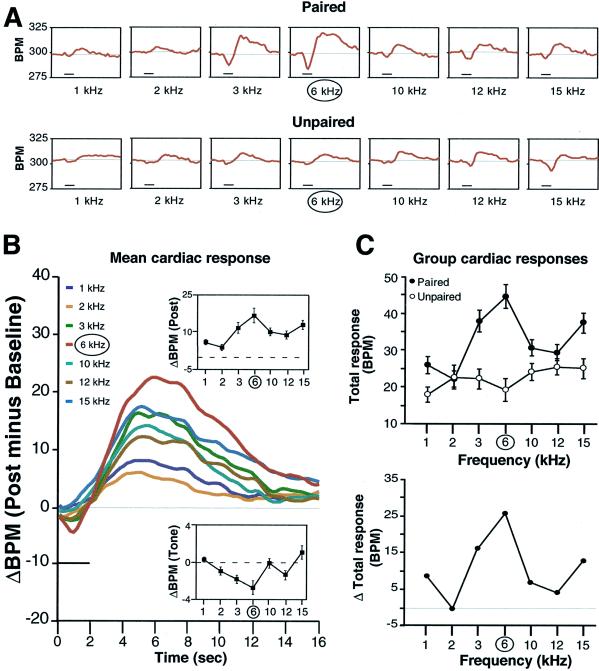
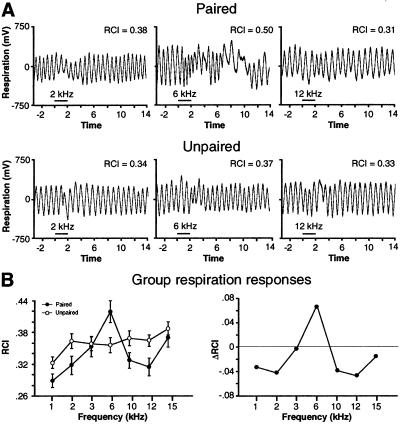
The nucleus basalis (NB) has been implicated in memory formation indirectly, by lesions, pharmacological manipulations, and neural correlates of learning. Prior findings imply that engagement of the NB during learning promotes memory storage. We directly tested this NB-memory hypothesis by determining whether stimulation of the NB induces behavioral associative memory. Rats were trained either with paired tone (6 kHz) and NB stimulation or with the two stimuli unpaired. We later determined the specificity of cardiac and respiratory behavioral responses to the training tone and several other acoustic frequencies. Paired subjects exhibited frequency generalization gradients with a peak of 6 kHz for both cardiac and respiratory behavior. Unpaired subjects exhibited no generalization gradient. The development of such specific, associative behavioral responses indicates that tone paired with NB stimulation induced behavioral associative memory. The discovery of memory induction by direct activation of the NB supports the NB-memory hypothesis and provides a potentially powerful way to control and investigate neural mechanisms of memory.


Figures

Figure 1
Figure 1
EEG for animals receiving either paired or unpaired 6-kHz tone and NB stimulation during training. (A) Examples of EEG records from individual animals. The first record shows that, during the pretraining determination of threshold level, NB stimulation alone (60 μA) elicited a shift of the EEG from higher amplitude, slower activity to lower amplitude, faster activity, i.e., EEG activation. The second record shows that the paired tone (6 kHz) produced EEG activation during testing. The third example shows a lack of activation to 6 kHz in the unpaired group. Calibrations: 2 s, 400 μV. (B) Group changes (mean ± SE) in the EEG of relative power in the gamma band (30–58 Hz) for all test tones. The paired group exhibited a maximum increase in gamma activity at the frequency of the paired tone, 6 kHz. The Inset presents the group difference function (paired minus unpaired functions) to show the specificity of EEG changes resulting from the difference in training. (Difference function for illustrative, not statistical, purposes.) Horizontal line denotes level of no change. Arrow indicates difference in response to 6 kHz.
Figure 2
Figure 2
Cardiac behavior (heart rate) during the test period. (A) Examples of individual records of heart rate (beats per minute, BPM) for one animal each in the paired and unpaired groups. Deflections below the baseline indicate bradycardia, those above show tachycardia. Horizontal bar indicates test tone duration (2 s). The largest response in the paired animal was to 6 kHz, which was not the case for the unpaired animal. (B) Average changes in heart rate to each test tone for the paired group. The Insets show mean (±SE) amplitude of response during (lower function) and after (upper function) the tones, respectively. Both functions show maximum change at the frequency of the paired tone. (C Upper) Biphasic cardiac response magnitude (mean ± SE peak to peak values) for each test frequency in the two groups. The paired group generalization gradient was significantly quadratic (P < 0.01), and 6 kHz was at the apex of the gradient. (Lower) The difference between group functions (paired minus unpaired) indicates the degree of specificity of cardiac response attributable to pairing per se.
Figure 3
Figure 3
Effects of test tones on respiration. (A) Examples of individual respiration records (with value of RCI) to three frequencies (2, 6, and 12 kHz) for one animal each from the paired and unpaired groups. The largest response was at 6 kHz for the paired animal (RCI = 0.50). Horizontal bar indicates tone duration. (B Left) Group mean (±SE) change in respiration to all tones for both groups. Left shows that the maximal response was at 6 kHz for the paired group but not for the unpaired group. The generalization gradient for only the paired group was significantly quadratic (P < 0.01), with responses to 6 kHz being of greatest magnitude. The group difference function (Right) shows a high degree of specificity of respiratory responses to 6 kHz.
Figure 4
Figure 4
Unconditioned effects of NB stimulation on heart rate and respiration. (A) Example of an individual heart rate response to stimulation (beats per minute, BPM). Vertical bar indicates 200-ms stimulation duration. (B) Example of an individual respiration response to stimulation (RCI = 0.53). Vertical bar indicates 200-ms stimulation duration. (C) Group heart rate response (peak to peak ± SE) across trials. (D) Group respiration response (RCI ± SE) across trials. The magnitude of heart rate and respiration response does not significantly change with repeated stimulation.

Similar articles

Cited by

References

    1. Iversen S D. Compt Rend Acad Sci Sci Vie. 1998;321:209–215. - PubMed
    1. Introini-Collison I B, McGaugh J L. Psychopharmacology. 1988;94:379–385. - PubMed
    1. Lehmann J, Nagy J I, Atmadia S, Fibiger H C. Neuroscience. 1980;5:1161–1174. - PubMed
    1. Mesulam M M, Mufson E J, Wainer B H, Levey A I. Neuroscience. 1983;10:1185–1201. - PubMed
    1. Casamenti F, Deffenu G, Abbamondi A L, Pepeu G. Brain Res Bull. 1986;16:689–695. - PubMed

Publication types