. 2002 Mar 19;99(6):4026-31.
doi: 10.1073/pnas.052379899.

Updating of the visual representation in monkey striate and extrastriate cortex during saccades

Affiliations

Updating of the visual representation in monkey striate and extrastriate cortex during saccades

Kae Nakamura et al. Proc Natl Acad Sci U S A. .

Abstract

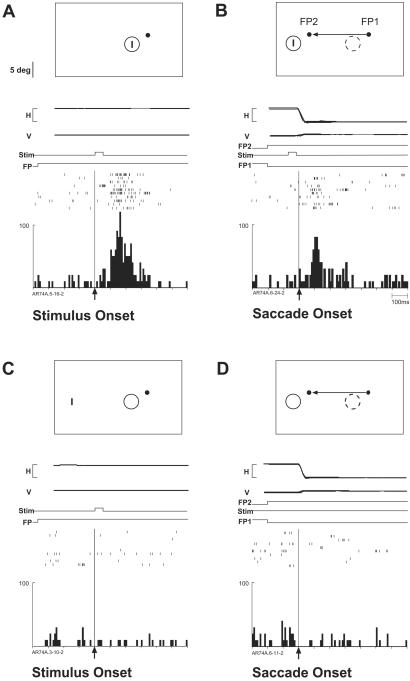
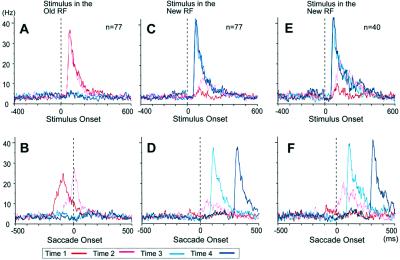
Neurons in the lateral intraparietal area, frontal eye field, and superior colliculus exhibit a pattern of activity known as remapping. When a salient visual stimulus is presented shortly before a saccade, the representation of that stimulus is updated, or remapped, at the time of the eye movement. This updating is presumably based on a corollary discharge of the eye movement command. To investigate whether visual areas also exhibit remapping, we recorded from single neurons in extrastriate and striate cortex while monkeys performed a saccade task. Around the time of the saccade, a visual stimulus was flashed either at the location occupied by the neuron's receptive field (RF) before the saccade (old RF) or at the location occupied by it after the saccade (new RF). More than half (52%) of V3A neurons responded to a stimulus flashed in the new RF even though the stimulus had already disappeared before the saccade. These neurons responded to a trace of the flashed stimulus brought into the RF by the saccade. In 16% of V3A neurons, remapped activity began even before saccade onset. Remapping also was observed at earlier stages of the visual hierarchy, including in areas V3 and V2. At these earlier stages, the proportion of neurons that exhibited remapping decreased, and the latency of remapped activity increased relative to saccade onset. Remapping was very rare in striate cortex. These results indicate that extrastriate visual areas are involved in the process of remapping.


Figures

Figure 1
Figure 1
Location and timing of stimulus presentation in the single-step task. The monkey makes a visually guided saccade from FP1 to FP2. (A) The RF moves from the old location associated with FP1 (old RF) to a new location associated with FP2 (new RF). The visual stimulus is flashed in either old RF or new RF. (B) The visual stimulus (Stim) is flashed either before or after the saccade.
Figure 2
Figure 2
A V3A neuron (RF size, 4 deg; eccentricity, 5.2 deg) that responds to the stimulus (Stim) trace after a saccade. The cartoons show the location of stimuli on the screen. The horizontal (H) and vertical (V) eye position (calibration bar, 20 deg) and the timing of stimulus events also are shown. Response rasters from 10 successful trials are aligned on the specified events and summed to generate a histogram. (A) Fixation task: the stimulus, a 3-deg bar, is flashed in the RF while the monkey fixates the FP. (B) Single-step task: while the monkey fixates FP1 the stimulus is flashed in the new RF for 50 ms and is extinguished before the saccade to FP2. After the saccade, the neuron fires, even though the stimulus is already gone. (C) Stimulus-only control: presentation of a stimulus outside the RF does not drive the neuron in the absence of a saccade. (D) Saccade-only control: the saccade alone does not drive the neuron in the absence of a stimulus. Target distance, size, and location of RF are drawn to scale.
Figure 3
Figure 3
Response to the stimulus (Stim) presented in the old (Middle) or new (Bottom) RF at four different timings (same neuron as Fig. 2). Data are aligned on stimulus onset. Inverted triangles indicate the mean time of saccade onset. The excitability at the new RF increases while excitability at the old RF decreases even before saccade onset (time 2). H, eye position in horizontal axis.
Figure 4
Figure 4
(A) A V3A neuron (RF size, 12 deg; eccentricity, 21 deg) that responds to the stimulus (Stim) flashed in the new RF even before a saccade. Same format as Fig. 2. In the single-step task (B), a visual stimulus is flashed in the new RF 33 ms after FP2 onset (time 1). H, horizontal; V, vertical.
Figure 5
Figure 5
Responses to stimuli (Stim) presented in the old or new RF (same neuron as in Fig. 4, same format as Fig. 3). This neuron responds to the stimulus presented in the new RF long before saccade onset (time 1). H, horizontal.
Figure 6
Figure 6
(A) Comparison of amplitude of response to the stimulus trace in the single-step task (new RF, time 2) to the response to the stimulus presented in the new RF at time 4 (217 ms after saccade offset). Filled bars indicate that the difference was significant (t test, P < 0, 05). (B) Response latency when the stimulus was presented 133 ms after FP2 onset (time 2), plotted against the latency of visual response in the fixation task. Each dot represents one neuron. Distribution histograms are shown at the side and bottom.
Figure 7
Figure 7
(A) Population activity of all V3A neurons studied. Mean activity for conditions in which the stimulus was presented in the old RF at four different times, aligned on stimulus onset. (B) Same data aligned on saccade onset. (C) Population response for the stimulus presented in the new RF. (D) Same data aligned on saccade onset. (E) Population activity for V3A neurons that exhibit remapping, for the stimulus presented in the new RF. (F) Same data aligned on saccade onset.
Figure 8
Figure 8
(A) Percentage of neurons that responded to the stimulus flashed in the new RF at time 2 in each visual area. Filled bars, neurons started responding after saccade onset. Shaded bars, neurons that started responding before saccade onset. (B) Perisaccadic change in responsiveness to a stimulus presented in the new RF. Normalized firing rate is plotted against the time of stimulus presentation relative to saccade onset. Negative values on the horizontal axis indicate that the stimulus is flashed before saccade onset. For each neuron there are four data points, for the four times at which the stimulus appeared: blue, time 1; black, time 2, red, time 3, and green, time 4. Firing rate is normalized as (response to the stimulus in new RF at time X)/(response to the stimulus at time 4). Neurons are judged to have no response if the activity does not change significantly relative to the baseline (100 ms before stimulus onset) and are plotted as zero.

References

    1. Hallett P E, Lightstone A D. Vision Res. 1976;16:107–114. - PubMed
    1. Mays L E, Sparks D L. J Neurophysiol. 1980;43:207–232. - PubMed
    1. Duhamel J R, Colby C L, Goldberg M E. Science. 1992;255:90–92. - PubMed
    1. Umeno M M, Goldberg M E. J Neurophysiol. 1997;78:1373–1383. - PubMed
    1. Walker M F, Fitzgibbon E J, Goldberg M E. J Neurophysiol. 1995;73:1988–2003. - PubMed

Publication types

LinkOut - more resources