. 2002 Mar 19;99(6):4032-6.
doi: 10.1073/pnas.062716299.

Frequency-dependent synchrony in locus ceruleus: role of electrotonic coupling

Affiliations

Frequency-dependent synchrony in locus ceruleus: role of electrotonic coupling

Veronica A Alvarez et al. Proc Natl Acad Sci U S A. .

Abstract

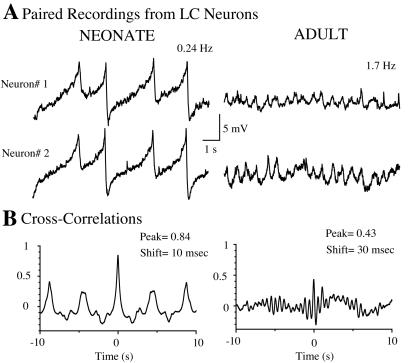
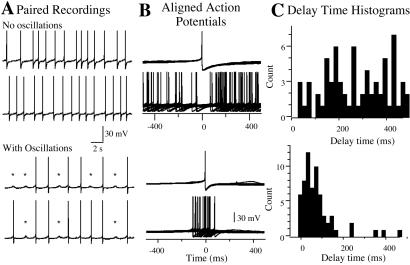
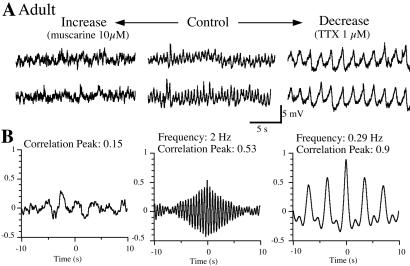
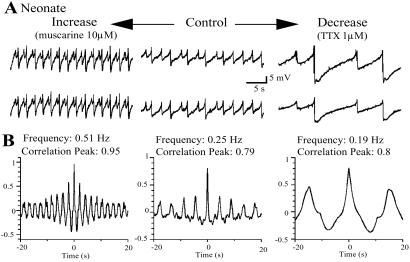
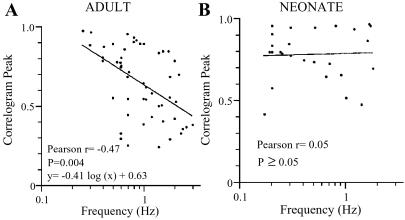
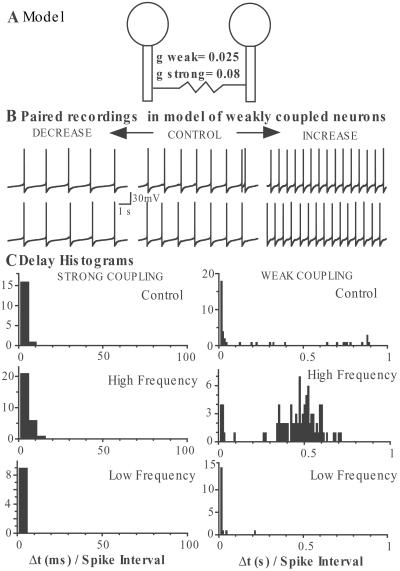
Electrotonic coupling synchronizes the spontaneous firing of locus ceruleus (LC) neurons in the neonatal rat brain, whereas in adults, synchronous activity is rare. This report examines the role of action potential frequency on synchronous activity in the adult LC. Decreasing the firing frequency in slices from adult animals facilitated the appearance of subthreshold oscillations and increased the correlation of the membrane potential between pairs of neurons. Conversely, increasing the firing frequency decreased the amplitude and synchrony of the oscillations among pairs. The frequency-dependent synchrony was not observed in slices from neonatal rats, where synchrony was observed at all frequencies, suggesting a developmental change in the properties of the LC network. A mathematical model confirmed that a reduction of the coupling strength among a pair of coupled neurons could generate frequency-dependent synchrony. In slices from adult animals, the combination of electrotonic coupling and firing frequency are the key elements that regulate synchronous firing in this nucleus.


Figures

Figure 1
Figure 1
Subthreshold oscillations are present in LC neurons from neonatal and adult rat brain slices. (A) Representative paired recordings of membrane potential from LC neurons in slices from a neonate (left) and an adult (right) rat brain. The frequency of the oscillations in this example was 0.24 Hz in the neonate and 1.7 Hz in the adult. (B) Cross-correlogram plots of the membrane potential recordings in neurons 1 and 2 for each pair of traces.
Figure 2
Figure 2
Synchronous action potentials are found in pairs of neurons having oscillations. (A) Paired recordings from neurons without (upper two traces) and with (lower two traces) subthreshold oscillations. Note subthreshold oscillation marked by *. (B) The action potentials in one neuron were aligned to the trace from the other cell. Action potentials in neuron 1 were set to time 0 and the time to the peak of action potential in neuron 2 (Δt) was determined. (C) Frequency histogram of Δt for each pair. The mean Δt for each histogram was calculated from the cumulative frequency plot obtained by integrating the frequency histogram. Note the different distribution.
Figure 3
Figure 3
Frequency controls oscillatory behavior in LC from adult animals. (A) Recordings from a pair of neurons in a slice from an adult in control (spontaneous frequency, middle traces) and when the excitability was increased (traces on left, muscarine at 10 μM) or decreased (traces on right, TTX at 1 μM). (B) Cross-correlogram of the recordings under these experimental conditions. Note the dramatic changes in rhythm and synchrony.
Figure 4
Figure 4
Oscillations are independent of the firing frequency in neonatal animals. (A) Paired recordings from LC neurons in a brain slice from a neonatal rat in control spontaneous frequency (middle traces) and when the excitability was increased by muscarine application (10 μM, traces on left) and decreased by TTX (traces on right, 1 μM). (B) Cross-correlogram of the recordings under these experimental conditions showed no changes in rhythm and synchrony.
Figure 5
Figure 5
Correlation between frequency and synchrony in adult LC. (A) In slices from adults, the frequency of the subthreshold oscillations correlates with the degree of synchrony (Pearson r = −0.47, P = 0.004). Pooled data from 31 pairs (n = 52) are plotted and the logarithmic equation y = −0.41⋅log(x) + 0.63 fits the data. (B) In neonatal slices, data from 13 pairs (n = 6) were pooled and no correlation was found (Pearson r = 0.05, P ≥ 0.05). The logarithmic equation y = 0.02⋅log(x) + 0.79 fits the data.
Figure 6
Figure 6
Frequency-dependent synchrony in a model of weakly coupled neurons. (A) Schematic diagram of the mathematical model using two two-compartment neurons electrically coupled by gap junctions between dendrites (see Materials and Methods). In the case of strong coupling, g (coupling conductance) was 0.08, and in the weak coupling model it was 0.025. (B) Paired recordings from the model with weak coupling when firing frequency is 0.9 Hz (control), 1.5 Hz (increase), and 0.6 Hz (decrease). (C) Delay histograms of spontaneous action potentials between the modeled neurons when firing frequency was 0.9 Hz (Top), 1.5 Hz (Middle), and 0.6 Hz (Bottom) and coupling conductance was strong (0.08, Left) or weak (0.025, Right). Δt values from the modeled data were obtained in the same way as the experimental Δt and expressed relative to the interspike interval (1/frequency).

References

    1. Llinás R, Sasaki K. Eur J Neurosci. 1989;1:587–602. - PubMed
    1. Beierlein M, Gibson J R, Connors B W. Nat Neurosci. 2000;3:904–910. - PubMed
    1. Galarreta M, Hestrin S. Nat Rev Neurosci. 2001;2:425–433. - PubMed
    1. Perez Velazquez J L, Carlen P L. Trends Neurosci. 2000;23:68–74. - PubMed
    1. Lang E J. J Neurosci. 2001;21:1663–1675. - PMC - PubMed

Publication types