. 2002 Mar 19;99(6):4043-8.
doi: 10.1073/pnas.062059899.

Wild-type and mutated presenilins 2 trigger p53-dependent apoptosis and down-regulate presenilin 1 expression in HEK293 human cells and in murine neurons

Affiliations

Wild-type and mutated presenilins 2 trigger p53-dependent apoptosis and down-regulate presenilin 1 expression in HEK293 human cells and in murine neurons

Cristine Alves da Costa et al. Proc Natl Acad Sci U S A. .

Erratum in

  • Proc Natl Acad Sci U S A 2002 Jun 25;99(13):9081. Mattson Marc P [corrected to Mattson Mark P]

Abstract

Presenilins 1 and 2 are two homologous proteins that, when mutated, account for most early onset Alzheimer's disease. Several lines of evidence suggest that, among various functions, presenilins could modulate cell apoptotic responses. Here we establish that the overexpression of presenilin 2 (PS2) and its mutated form Asn-141-Ile-PS2 alters the viability of human embryonic kidney (HEK)293 cells as established by combined trypan blue exclusion, sodium 3'-[1-(phenylamino-carbonyl)-3,4-tetrazolium]-bis(4-methoxy-6-nitro)benzene sulfonic acid hydrate assay, and propidium iodide incorporation FACS analyses. The two parent proteins increase the acetyl-DEVD-al-sensitive caspase-3-like activity in both HEK293 cells and Telencephalon specific murine neurons, modulate Bax and bcl-2 expressions, and enhance cytochrome C translocation into the cytosol. We show that overexpression of both wild-type and mutated PS2 increases p53-like immunoreactivity and transcriptional activity. We also establish that wild-type- and mutated PS2-induced caspase activation is reduced by p53 antisense approach and by pifithrin-alpha, a chemical inhibitor of p53. Furthermore, mouse fibroblasts in which the PS2 gene has been knocked out exhibited strongly reduced p53-transcriptional activity. Finally, we establish that the overexpression of both wild-type and mutated PS2 is accompanied by a drastic reduction of endogenous presenilin 1 (PS1) expression. Interestingly, pifithrin-alpha diminished endogenous PS2 immunoreactivity, whereas the inhibitor increases PS1 expression. Altogether, our data demonstrate that wild-type and familial Alzheimer's disease-linked PS2 trigger apoptosis and down-regulate PS1 expression through p53-dependent mechanisms.


Figures
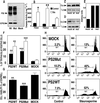
Figure 1
Figure 1
Apoptotic phenotypes of wt and N141I-PS2-expressing HEK293 cells. (A) Western blot analysis (see Materials and Methods) of PS2-like immunoreactivities in Mock-transfected HEK293 cells (Mock) and cells overexpressing wt (Wt) or N141I-(Mut) PS2. Arrows indicate either the migration position of PS2 holoprotein or its C-terminal catabolite (CPS2). Note that the smir of holoprotein immunoreactivity corresponds to the previously characterized polyubiquitinated forms of PS2 (19). (B) Basal and staurosporine-induced (STS, 2 μM, 24 h) caspase 3-like activity (see Materials and Methods) in the indicated cell lines. Bars represent the Ac-DEVD-al-sensitive caspase 3-like activity and are the means +/−SEM of six determinations carried out in duplicates. *, P < 0,05; **, P < 0,01 (versus staurosporine-treated Mock-transfected cells). Bax (C), Bcl-2 (D), and tubulin immunoreactivities (see Materials and Methods) in the indicated cell lines. Cytochrome C-like immunoreactivity (E) in cytosolic and mitochondrial fractions (see details in Materials and Methods). Bars represent the ratio of cytochrome C content in cytosol versus mitochondrial fractions. (F) Trypan blue exclusion measured (see Materials and Methods) on the indicated cell lines in the absence (black bars) or presence (white bars) of staurosporine. Trypan blue positive (nonviable) cells are expressed as percent of total cells. Bars are the means of six determinations +/−SEM. **, P < 0,01; ***, P < 0,001 (versus Mock-transfected cells). (G) Cell viability measurements by XTT (see Materials and Methods). Bars represent residual cell viability after staurosporine treatment expressed as the percent (taken as 100) of cell viability in control conditions and are the means ±SEM of 10 determinations. **, P < 0,05; ***, P < 0,01. (H) Representative illustration of PI incorporation measured in the indicated cell lines in control and staurosporine-stimulated conditions (see F) by FACS analysis (similar data were obtained in four independent experiments). The number of apoptotic nuclei is expressed as a percentage of the total number of events (see Materials and Methods for details).
Figure 2
Figure 2
p53-dependent PS2-induced caspase activation in HEK293 and TSM1 cells. (A, C) p53 and tubulin immunoreactivities (see Materials and Methods) in PS2-expressing HEK293 transfectants (A) or in TSM1 neurons (C) expressing empty vector (TSM1/Mock) or p53-antisense cDNA (TSM1/ASp53). (B) Effect of pifithrin-α. The indicated HEK293 transfectants were treated for 24 h with 2 μM staurosporine in the absence (black bars, control) or presence (white bars) of 10 μM pifithrin-α (PFT). Bars represent the means +/−SEM of six determinations carried out in duplicate. (D) Staurosporine-stimulated (1 μM, 2 h) caspase activity in TSM1/Mock and TSM1/ASp53 neurons transiently transfected with pcDNA3 empty or bearing wt or mutated PS2.
Figure 3
Figure 3
p53 transcriptional activity in wt PS2-expressing HEK293 cells and in PS2−/− fibroblasts. (A, C) p53 transcriptional activity measured with a p53 reporter gene construct (pG13-luciferase) in wt PS2-expressing HEK293 cells (A) or in PS2−/− fibroblasts (C). (B) p53 transcriptional activity measured in wt PS2-HEK293 cells with a construct coding for the p21waf-1 promotor-luciferase as described in Materials and Methods. All data have been normalized for transfection efficiencies assessed by cotransfection experiments with a β-galactosidase expression vector.
Figure 4
Figure 4
Down-regulation of endogenous PS1 expression in wt- and mutated N141I-PS2-expressing HEK293 cells: effect of pifithrin-α. (A) Endogenous PS1-like and tubulin immunoreactivities (see Materials and Methods) in the indicated cell lines. (B) Densitometric analyses of the N-terminal PS1 fragment (NTF-PS1) are the means +/−SEM of four determinations. Note that, as described (49), endogenous presenilin holoproteins are barely detectable as the protein is rapidly fully processed. (C) Effect of pifithrin-α on endogenous PS1- and PS2-related immunoreactivities. Cells (as in A) were treated for 24 h in the absence (−) or presence (+) of 10 μM pifithrin-α (PFT), then endogenous PS1- and PS2-like immunoreactivities were monitored by Western blot with Ab444 and Ab333 (see Materials and Methods). Bars in D correspond to the densitometric analysis of the N-terminal PS1 (two left bars) and C-terminal PS2 (two right bars) fragments obtained in the absence (black bars) or presence (white bars) of pifithrin-α and are the means +/−SEM of four determinations.

References

    1. Van Broeckhoven C, Backhovens H, Cruts M, De Winter G, Bruyland M, Cras P, Martin J J. Nat Genet. 1992;2:335–339. - PubMed
    1. Haass C. Neurons. 1997;18:687–690. - PubMed
    1. Hutton M, Hardy J. Hum Mol Gen. 1997;6:1639–1646. - PubMed
    1. Checler F. IUBMB Life. 1999;48:33–39. - PubMed
    1. Cotman C W, Anderson A J. Mol Neurobiol. 1995;10:19–45. - PubMed

Publication types

MeSH terms

LinkOut - more resources