. 2002 Mar;13(3):830-46.
doi: 10.1091/mbc.01-09-0435.

Stretch-regulated exocytosis/endocytosis in bladder umbrella cells

Affiliations

Stretch-regulated exocytosis/endocytosis in bladder umbrella cells

Steven T Truschel et al. Mol Biol Cell. 2002 Mar.

Abstract

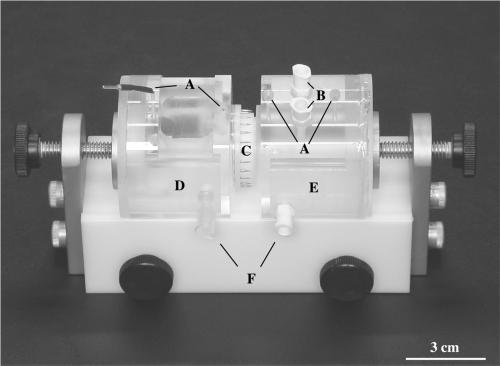
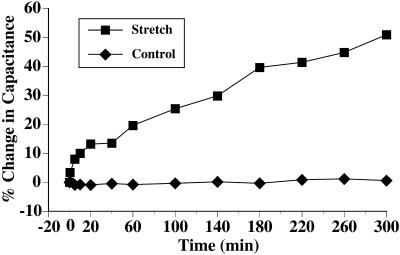
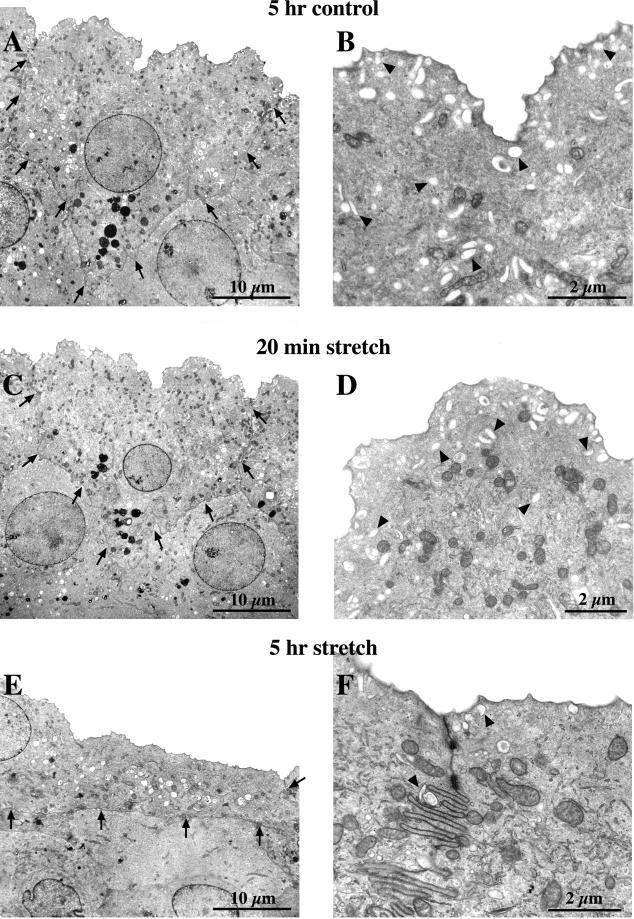
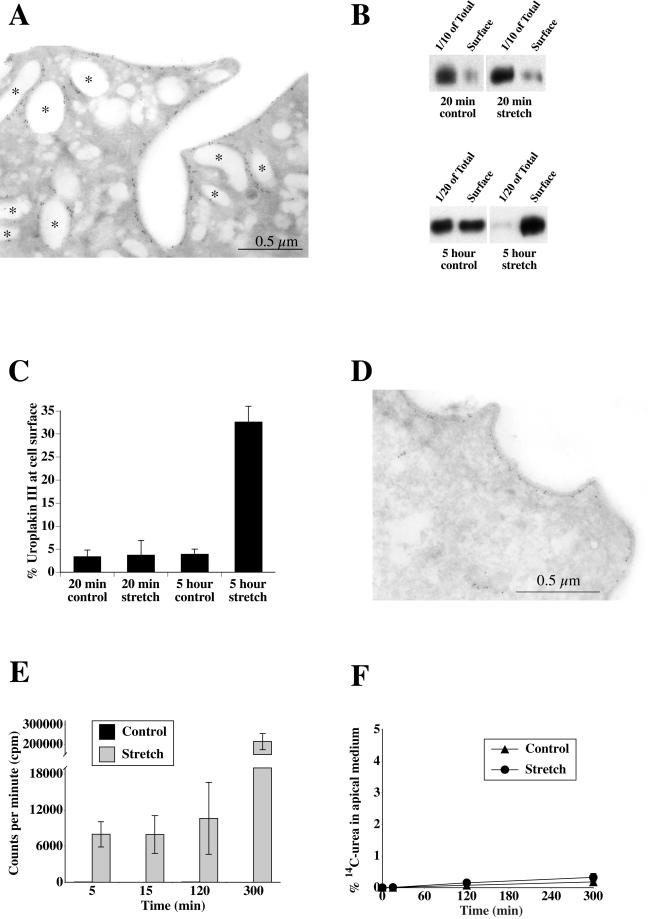
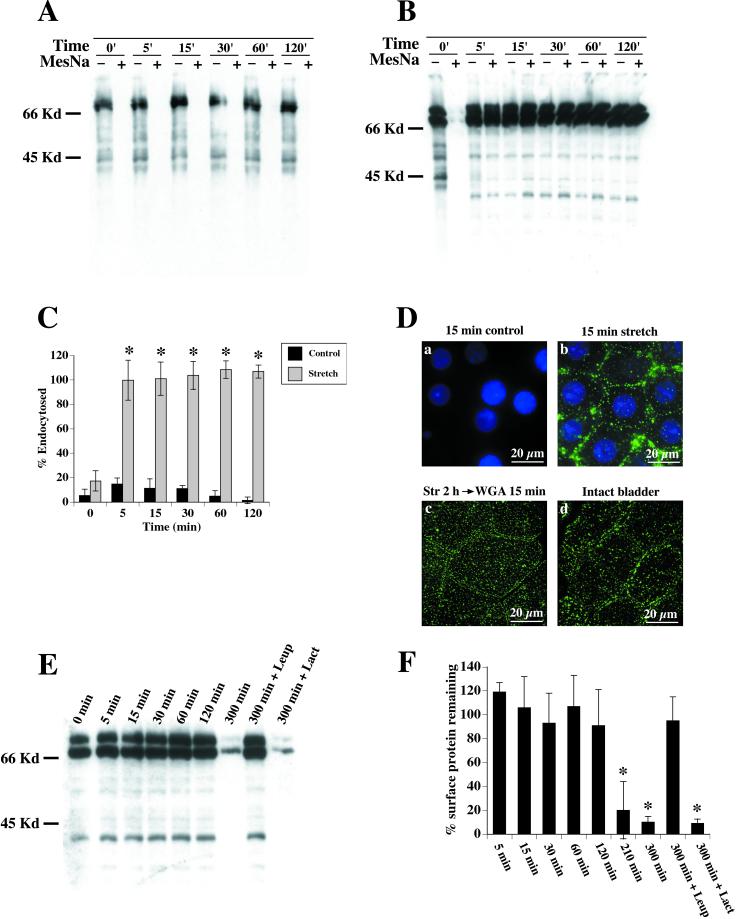
The epithelium of the urinary bladder must maintain a highly impermeable barrier despite large variations in urine volume during bladder filling and voiding. To study how the epithelium accommodates these volume changes, we mounted bladder tissue in modified Ussing chambers and subjected the tissue to mechanical stretch. Stretching the tissue for 5 h resulted in a 50% increase in lumenal surface area (from approximately 2900 to 4300 microm(2)), exocytosis of a population of discoidal vesicles located in the apical cytoplasm of the superficial umbrella cells, and release of secretory proteins. Surprisingly, stretch also induced endocytosis of apical membrane and 100% of biotin-labeled membrane was internalized within 5 min after stretch. The endocytosed membrane was delivered to lysosomes and degraded by a leupeptin-sensitive pathway. Last, we show that the exocytic events were mediated, in part, by a cyclic adenosine monophosphate, protein kinase A-dependent process. Our results indicate that stretch modulates mucosal surface area by coordinating both exocytosis and endocytosis at the apical membrane of umbrella cells and provide insight into the mechanism of how mechanical forces regulate membrane traffic in non-excitable cells.


Figures

Figure 1
Figure 1
Modified Ussing chambers used to stretch bladder tissue. Electrode ports (A), Luer ports (B), plastic ring containing excised tissue (C), basal (serosal) chamber (D), apical (mucosal) chamber (E), and water jacket ports (F).
Figure 2
Figure 2
Capacitance changes in response to stretch. Bladder tissue was mounted and equilibrated as described in MATERIALS AND METHODS. The change in capacitance of stretched cells (▪) or unstretched control cells (♦) is shown. Data is mean ± SEM (n = 5). The error bars are smaller than the symbols.
Figure 3
Figure 3
Morphological analysis of control and stretched umbrella cells. Cells were mounted in chambers and incubated for 5 h without stretch (A and B), or stretched for 20 min (C and D) or 5 h (E and F), fixed, and processed for TEM. (A, C, and E) Low-magnification views of representative umbrella cells from each experimental condition. The arrows delineate the borders of the cells. (B, D, and F) Higher magnification views of the apical portion of each umbrella cell. Representative discoidal vesicles are marked by arrowheads.
Figure 4
Figure 4
Stereological analysis of umbrella cells and determination of vesicle/membrane continuity. (A) Mounted bladder tissue was fixed in the presence of 0.01% (wt/vol) ruthenium red and processed for TEM. Arrows point to discoidal vesicles that are in proximity, but not continuous with the apical membrane. (B–F) Serial sections of an umbrella cell reveal the discontinuity of vesicles with each other and the plasma membrane. Arrowheads depict individual discoidal vesicles as they appear and disappear within the sections. The dashed box surrounds an area of clustered discoidal vesicles that remain distinct from one another in all sections. A large plasma membrane-associated vesicle is marked with an asterisk. Uroepithelium was incubated in chambers for 20 min with stretch (░⃞) or without (▪) (G) or for 5 h with stretch (░⃞) or without stretch (▪) (H). The apical, basolateral, and vesicle surface areas were determined as described in MATERIALS AND METHODS. Shown is mean ± SEM (n = 50). Values that are significantly different (p < 0.05) from matched control values are marked with an asterisk.
Figure 5
Figure 5
Uroplakin III localization and stretch-induced increases in cell surface uroplakin III expression and metabolically labeled protein secretion. (A) Ultrathin cryosections of 5-h control tissue labeled with anti-uroplakin III antibody and secondary antibody conjugated to 5-nm gold. Asterisks denote examples of uroplakin III-positive vesicles. (B) Representative Western blots of total and cell surface uroplakin III expression in control or stretched samples. The bottom panel is exposed longer to allow the total cell signal in stretched samples to be visible. (C) Quantification of relative expression of cell-associated uroplakin III at the apical surface for each condition. Shown is mean ± SEM (n = 5). (D) Samples were stretched for 5 h and labeled with anti-uroplakin III antibody and secondary antibody conjugated to 5-nm gold. (E) Cells were pulsed with [35S]cysteine/methionine, chased for 1 h, and stretched or incubated without stretch for 5, 15, 120, or 300 min. Shown is average cpm present in apical medium at each time point ± SEM (n = 3). (F) Percentage of basally added [14C]urea that appeared in the apical medium after 0, 15, 120, or 300 min of stretch or incubation without stretch. Shown is mean ± SEM (n = 3).
Figure 6
Figure 6
Effect of stretch on endocytosis. Umbrella cells were surface biotinylated and incubated for 0, 5, 15, 30, 60, or 120 min without stretch (A) or with stretch (B). MESNA-protected biotinylated proteins were isolated and Western blots were probed with streptavidin-HRP. Representative blot of control tissue (A) shows no visible endocytosis by the lack of signal in MESNA-treated lanes. Stretched tissue (B) exhibits large MESNA-protected signal, indicating endocytosis. (C) Quantification of endocytosis in control and stretched tissue. Shown is mean ± SEM (n = 5). Values that are significantly different (p < 0.05) from matched control values are marked with an asterisk. (D) WGA-FITC was internalized for 15 min in control unstretched (a) or stretched (b) tissue. Surface-bound WGA-FITC was removed by incubation at 4°C with N-acetyl glucosamine, and the samples were fixed, stained with 4,6-diamidino-2-phenylindole, and then examined byepifluorescence microscopy. A projection of digitally deconvoluted sections is shown. (Dc) Bladder cells were stretched for 2 h, WGA-FITC was added to the chamber and the samples stretched for an additional 15 min. Surface WGA-FITC was removed, the samples were fixed, and then examined in a confocal microscope. A projection of multiple XY sections is shown. (Dd) WGA-FITC was added to an excised but otherwise intact bladder for 15 min. Surface WGA-FITC was removed, the samples were fixed, and then examined in a confocal microscope. A projection of multiple XY sections is shown. (E) Apical surface proteins were biotinylated and the tissue was stretched for 0–300 min. The cells were lysed and biotinylated proteins detected by probing Western blots with streptavidin-HRP. Treatment with 40 μM leupeptin (Leup) prevented the degradation, demonstrating a lysosomal-mediated pathway, whereas treatment with lactacystin (Lact) had no effect. (F) Quantification of apical membrane protein degradation upon stretch. Values are relative to unstretched tissue biotinylated at t = 0. Shown is mean ± SEM (n = 4). Values that are significantly different (p < 0.5) from unstretched tissue at t = 0 are marked with an asterisk.
Figure 7
Figure 7
Role of cAMP and PKA in the stretch response. (A) Intracellular levels of cAMP were measured in control cells (▪) and stretched cells (░⃞) after 15, 30, 120, or 300 min. Shown is mean ± SEM (n = 4). Values that are significantly different (p < 0.05) from matched control values are marked with an asterisk. (B) Effects of forskolin and H89 on capacitance. Cells were treated with 10 μM forskolin/500 μM IBMX without stretch (▪), treated with forskolin/IBMX and 10 μM H89 (▴), or stretched in the presence of 10 μM H89 alone (●). For comparison, the capacitance readings from Figure 1 of stretched (♦) and control (□) cells are shown. Shown is mean ± SEM (n = 6). (C) Effects of forskolin/IBMX on umbrella cell morphology. Tissue was treated with forskolin/IBMX without stretch for 5 h and processed for TEM. Notice the highly convoluted apical membrane. (D) Changes in surface area resulting from Forskolin/IBMX treatment. Tissue was treated with forskolin/IBMX (░⃞) and stereological analysis was performed as described. Control surface areas are shown for comparison (▪), n = 50. Values that are significantly different (p < 0.05) from matched control values are marked with an asterisk. (E) Endocytosis was determined in forskolin/IBMX-treated cells. Shown is representative Western blot after 0, 5, 15, 30, 60, or 120 min with or without MESNA treatment.

Similar articles

Cited by

References

    1. Altschuler Y, Kinlough C, Poland P, Apodaca G, Weisz O, Hughey R. Clathrin-mediated endocytosis of MUC1 is regulated by glycosylation. Mol Biol Cell. 2000;11:819–831. - PMC - PubMed
    1. Amano O, Kataoka S, Yamamoto T. Turnover of asymmetric unit membranes in the transitional epithelial superficial cells of the rat urinary bladder. Anat Rec. 1991;229:9–15. - PubMed
    1. Apodaca G, Katz L, Mostov K. Receptor-mediated transcytosis of IgA in MDCK cells is via apical recycling endosomes. J Cell Biol. 1994;125:67–86. - PMC - PubMed
    1. Apodaca G. Modulation of membrane traffic by mechanical stimuli. Am J Physiol. 2002;282:F179–F190. - PubMed
    1. Baddeley A, Gunderson H, Cruz-Orive L. Estimation of surface area from vertical sections. J Microsc. 1986;142:259–276. - PubMed

Publication types

MeSH terms

LinkOut - more resources