. 2002 Apr;22(8):2607-19.
doi: 10.1128/MCB.22.8.2607-2619.2002.

Conditional disruption of the peroxisome proliferator-activated receptor gamma gene in mice results in lowered expression of ABCA1, ABCG1, and apoE in macrophages and reduced cholesterol efflux

Affiliations

Conditional disruption of the peroxisome proliferator-activated receptor gamma gene in mice results in lowered expression of ABCA1, ABCG1, and apoE in macrophages and reduced cholesterol efflux

Taro E Akiyama et al. Mol Cell Biol. 2002 Apr.

Abstract

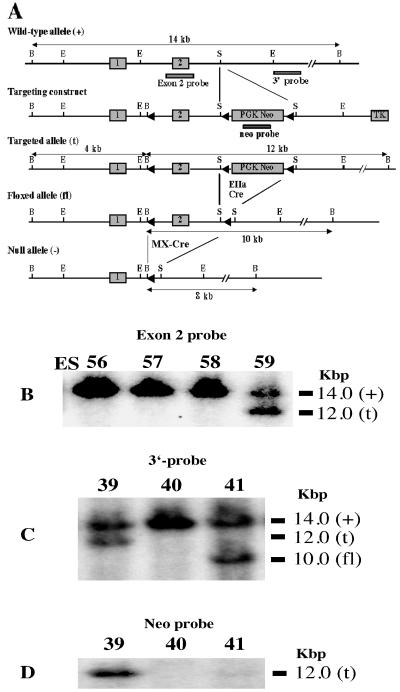
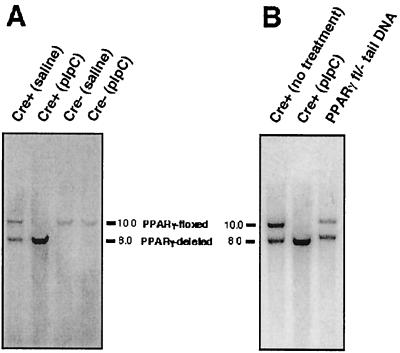
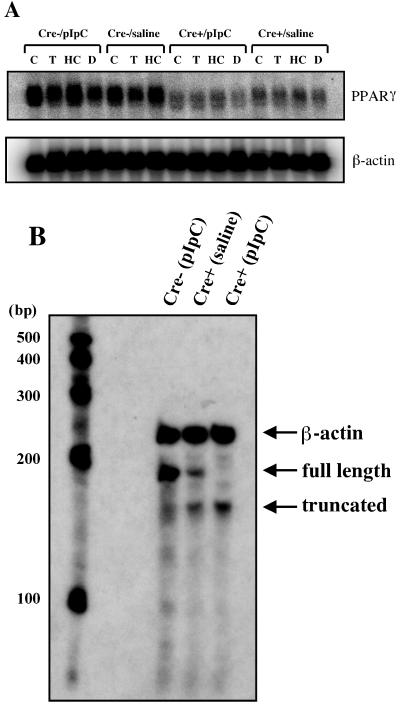
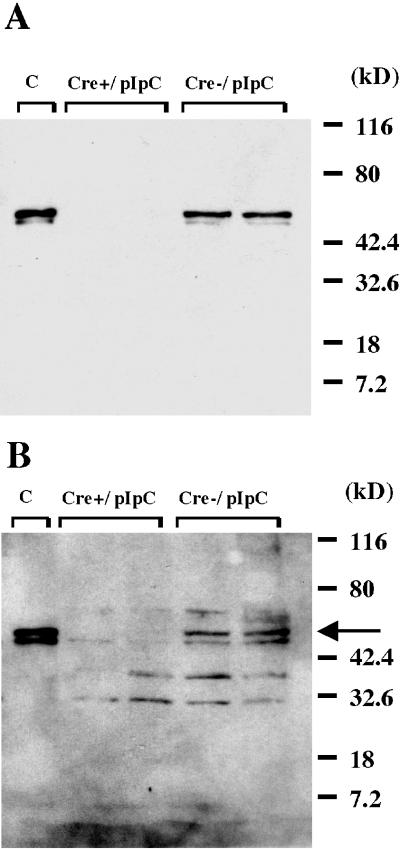
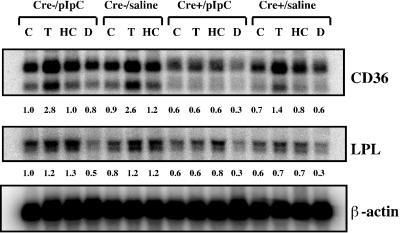
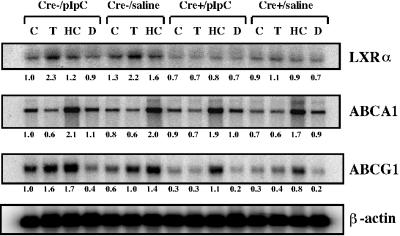
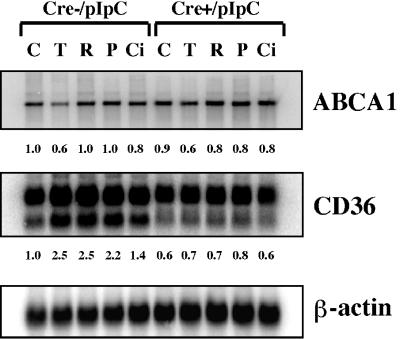
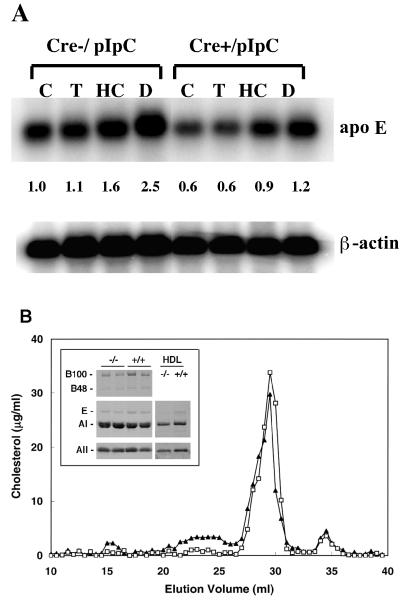
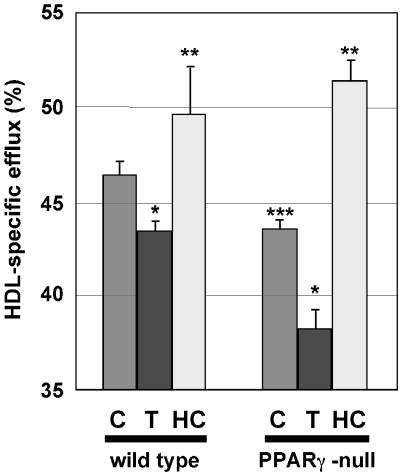
Disruption of the peroxisome proliferator-activated receptor gamma (PPAR gamma) gene causes embryonic lethality due to placental dysfunction. To circumvent this, a PPAR gamma conditional gene knockout mouse was produced by using the Cre-loxP system. The targeted allele, containing loxP sites flanking exon 2 of the PPAR gamma gene, was crossed into a transgenic mouse line expressing Cre recombinase under the control of the alpha/beta interferon-inducible (MX) promoter. Induction of the MX promoter by pIpC resulted in nearly complete deletion of the targeted exon, a corresponding loss of full-length PPAR gamma mRNA transcript and protein, and marked reductions in basal and troglitazone-stimulated expression of the genes encoding lipoprotein lipase, CD36, LXR alpha, and ABCG1 in thioglycolate-elicited peritoneal macrophages. Reductions in the basal levels of apolipoprotein E (apoE) mRNA in macrophages and apoE protein in total plasma and high-density lipoprotein (HDL) were also observed in pIpC-treated PPAR gamma-MXCre(+) mice. Basal cholesterol efflux from cholesterol-loaded macrophages to HDL was significantly reduced after disruption of the PPAR gamma gene. Troglitazone selectively inhibited ABCA1 expression (while rosiglitazone, ciglitazone, and pioglitazone had little effect) and cholesterol efflux in both PPAR gamma-deficient and control macrophages, indicating that this drug can exert paradoxical effects on cholesterol homeostasis that are independent of PPAR gamma. Together, these data indicate that PPAR gamma plays a critical role in the regulation of cholesterol homeostasis by controlling the expression of a network of genes that mediate cholesterol efflux from cells and its transport in plasma.


Figures

FIG. 1.
FIG. 1.
Gene targeting and conditional deletion of exon 2 of the PPARγ gene. (A) Restriction maps of the wild-type allele, targeting vector, targeted allele, floxed allele, and null allele. The indicated probes (3′-probe, exon 2, and neo probe) were used to assess recombination events. Open boxes represent exons and are numbered as indicated. PGK neomycin (PGK Neo) and thymidine kinase (TK) are positive and negative selection cassettes, respectively. Restriction sites: B, BamHI; E, EcoRI; S, SacI. (B) Southern blot analysis of homologous recombination in ES cells electroporated with the targeting vector. DNA derived from ES cells were digested with BamHI. Hybridizing fragments of wild-type (+) and targeted (t) alleles to the exon 2 probe and their respective sizes are indicated. Similar results were obtained with the 3′-probe (not shown). (C) Southern blot analysis of BamHI-digested tail DNA from pups derived from the cross between heterozygous (t/+) males and EIIaCre females (schematically shown in panel A). Hybridizing fragments of wild-type (+), targeted (t), and floxed (fl) alleles to the 3′-probe and their respective sizes are indicated. Recombination between loxP sites 2 and 3 was demonstrated with tail DNA derived from the mouse designated “41,” although other recombination events were observed. Similar results were obtained with the exon 2 probe (not shown). (D) Southern blot analysis of tail DNA used in panel C. A 12-kbp hybridizing fragment of the targeted (t) allele, but not wild-type (+) and floxed (fl) alleles, to the neo probe is indicated.
FIG. 2.
FIG. 2.
(A) Southern blot analysis of BamHI-digested genomic DNA isolated from thioglycolate-elicited peritoneal macrophages from saline-treated PPARγ-MXCre+, pIpC-treated PPARγ-MXCre+, saline-treated PPARγ-MXCre, and pIpC-treated PPARγ-MXCre mice, as indicated. Hybridizing fragments of floxed and deleted alleles to the 3′-probe and their respective sizes are indicated. (B) Southern blot analysis of BamHI-digested genomic DNA isolated from macrophages of untreated PPARγ-MXCre+ mice, thioglycolate-elicited peritoneal macrophages from pIpC-treated PPARγ-MXCre+ mice, and tail of PPARγfl/− mice, as indicated. Hybridizing fragments of floxed and deleted alleles to the 3′-probe and their respective sizes are indicated.
FIG. 3.
FIG. 3.
(A) Northern blot analysis of total RNA from thioglycolate-elicited peritoneal macrophages of PPARγ-MXCre and PPARγ-MXCre+ mice treated with saline or pIpC, as indicated. Macrophages were treated with the indicated ligands [15 μM troglitazone (T), 2.5 μg of 22-HC/ml, 100 nM dexamethasone (D), and DMSO vehicle (C)] and total macrophage RNA (10 μg) was denatured and electrophoresed in formaldehyde-containing 1% agarose gels, blotted to nylon membranes, and probed with the indicated cDNA probes for PPARγ and β-actin. (B) RNase protection assay. Total RNA from thioglycolate-elicited peritoneal macrophages of pIpC-treated PPARγ-MXCre (lane 1), saline-treated PPARγ-MXCre+ (lane 2), and pIpC-treated PPARγ-MXCre+ (lane 3) mice were hybridized with riboprobes for β-actin and PPARγ (as described in Materials and Methods) and subjected to digestion with RNase H. The products were then separated on a 5.0% polyacrylamide gel. Positions of the protected mRNA fragments for PPARγ and β-actin, as well as the expected size of the PPARγ truncated mRNA, are indicated.
FIG. 4.
FIG. 4.
Western blot analysis of nuclear extracts from macrophages of pIpC-treated PPARγ-MXCre+ mice and similarly treated PPARγ-MXCre mice. A total of 10 μg of protein from nuclear extracts of macrophages and 10 μg of total protein from Hepa-1 cells transfected with an expression vector for PPARγ1 (pSG5-PPARγ cDNA) were subjected to electrophoresis on a 4 to 15% Tris-HCl gradient gel (Bio-Rad), transferred to Immobilon-P membranes (Millipore), and probed as recommended by the manufacturer with anti-PPARγ antibodies (Santa Cruz Biotechnologies) specific for the N terminus (E-8, PPARγ antibody) (A) and the C terminus (H-100, PPARγ antibody) (B) of the PPARγ protein. Detection of immunoreactive proteins was done by using an enhanced chemiluminescence blot detection system (Amersham).
FIG. 5.
FIG. 5.
Northern blot analysis of total RNA from thioglycolate-elicited peritoneal macrophages of PPARγ-MXCre and PPARγ-MXCre+ mice treated with saline or pIpC, as indicated. Macrophages were treated with the indicated ligands [15 μM troglitazone (T), 2.5 μg of 22-HC (HC)/ml, 100 nM dexamethasone (D), and DMSO vehicle (C)], and total macrophage RNA (10 μg) was denatured and electrophoresed in formaldehyde-containing 1% agarose gels, blotted onto nylon membranes, and probed with the indicated cDNA probes for CD36, LPL, and β-actin. The intensities of hybridizing mRNA bands were quantitated and normalized to β-actin mRNA. Numbers represent signal intensities relative to pIpC-treated Cre macrophages (lane 1).
FIG. 6.
FIG. 6.
Northern blot analysis of total RNA from thioglycolate-elicited peritoneal macrophages of PPARγ-MXCre and PPARγ-MXCre+ mice treated with saline or pIpC, as indicated. Macrophages were treated with the indicated ligands [15 μM troglitazone (T), 2.5 μg of 22-HC (HC)/ml, 100 nM dexamethasone (D), and DMSO vehicle (C)], and total macrophage RNA (10 μg) was denatured and electrophoresed in formaldehyde-containing 1% agarose gels, blotted onto nylon membranes, and probed with the indicated cDNA probes for LXRα, ABCA1, ABCG1, and β-actin. The intensities of hybridizing mRNA bands were quantitated and normalized to β-actin mRNA. The numbers represent signal intensities relative to pIpC-treated Cre macrophages (lane 1).
FIG. 7.
FIG. 7.
Northern blot analysis of total RNA from thioglycolate-elicited peritoneal macrophages of PPARγ-MXCre and PPARγ-MXCre+ mice treated with pIpC, as indicated. Macrophages were treated with the indicated ligands [15 μM troglitazone (T), 5 μM rosiglitazone (R), 10 μM pioglitazone (P), 13 μM ciglitazone (Ci), and DMSO vehicle (C)], and the total macrophage RNA (10 μg) was denatured and electrophoresed in formaldehyde-containing 1% agarose gels, blotted onto nylon membranes, and probed with the indicated cDNA probes for ABCA1, CD36, and β-actin. The intensities of hybridizing mRNA bands were quantitated and normalized to β-actin mRNA. The numbers represent signal intensities relative to pIpC-treated Cre macrophages (lane 1).
FIG. 8.
FIG. 8.
(A) Northern blot analysis of total RNA from thioglycolate-elicited peritoneal macrophages of pIpC-treated PPARγ-MXCre or PPARγ-MXCre+ mice. Macrophages were treated with the indicated ligands [15 μM troglitazone (T), 2.5 μg of 22-HC (HC)/ml, 100 nM dexamethasone (D), and DMSO vehicle (C)], and total macrophage RNA (10 μg) was denatured and electrophoresed in formaldehyde-containing 1% agarose gels, blotted to nylon membranes, and probed with the indicated cDNA probes for apoE and β-actin. The intensities of the hybridizing mRNA bands were quantitated and normalized to β-actin mRNA. The numbers represent signal intensities relative to pIpC-treated Cre macrophages (lane 1). (B) Lipid profiles in serum of pIpC-treated PPARγ-MXCre and pIpC-treated PPARγ-MXCre+ mice. Lipoproteins were separated from 100 μl of pooled mouse plasma samples by FPLC (n = 4 for each group). Profiles from pIpC-treated PPARγ-MXCre (control; ▴) and pIpC-treated PPARγ-MXCre+ (□) mice are shown. Concentrations of cholesterol are indicated on the y axis. (Inset) Immunoblot analysis of apolipoproteins B, E, A-I, A-II, and Cs in plasma and in HDL fraction from pIpC-treated PPARγ-MXCre (control) and pIpC-treated PPARγ-MXCre+ mice, as indicated.
FIG. 9.
FIG. 9.
Thioglycolate-elicited peritoneal macrophages from pIpC-treated PPARγ-MXCre and pIpC-treated PPARγ-MXCre+ mice were plated in 24-well plates and incubated for 24 h in RPMI 1640 supplemented with 10% fetal bovine serum and [3H]cholesterol in the absence or presence of 15 μM troglitazone or 2.5 μg of 22-HC (HC)/ml as indicated. HDL-dependent cholesterol efflux to the medium was determined as described in Materials and Methods. Data are presented as a percentage (± the standard error) of the total radioactivity in the cells and the medium. Each point is a numerical average of quadruplicate experiments. The PPARγ-independent effects of troglitazone and 22-HC, as well as the reduction of cholesterol efflux in PPARγ-deficient macrophages, are statistically significant at P values of <0.05 and are indicated by the asterisks (★, ★★, and ★★★, respectively).

References

    1. Babaev, V. R., S. Fazio, L. A. Gleaves, K. J. Carter, C. F. Semenkovich, and M. F. Linton. 1999. Macrophage lipoprotein lipase promotes foam cell formation and atherosclerosis in vivo. J. Clin. Investig. 103:1697-1705. - PMC - PubMed
    1. Babaev, V. R., M. B. Patel, C. F. Semenkovich, S. Fazio, and M. F. Linton. 2000. Macrophage lipoprotein lipase promotes foam cell formation and atherosclerosis in low density lipoprotein receptor-deficient mice. J. Biol. Chem. 275:26293-26299. - PubMed
    1. Barak, Y., M. C. Nelson, E. S. Ong, Y. Z. Jones, P. Ruiz-Lozano, K. R. Chien, A. Koder, and R. M. Evans. 1999. PPARγ is required for placental, cardiac, and adipose tissue development. Mol. Cell 4:585-595. - PubMed
    1. Basheeruddin, K., C. Rechtoris, and T. Mazzone. 1992. Transcriptional and post-transcriptional control of apolipoprotein E gene expression in differentiating human monocytes. J. Biol. Chem. 267:1219-1224. - PubMed
    1. Basu, S. K., J. L. Goldstein, and M. S. Brown. 1983. Independent pathways for secretion of cholesterol and apolipoprotein E by macrophages. Science 219:871-873. - PubMed

Publication types

MeSH terms