. 2002 Apr;22(8):2620-31.
doi: 10.1128/MCB.22.8.2620-2631.2002.

Inducer-specific enhanceosome formation controls tumor necrosis factor alpha gene expression in T lymphocytes

Affiliations

Inducer-specific enhanceosome formation controls tumor necrosis factor alpha gene expression in T lymphocytes

Alla V Tsytsykova et al. Mol Cell Biol. 2002 Apr.

Abstract

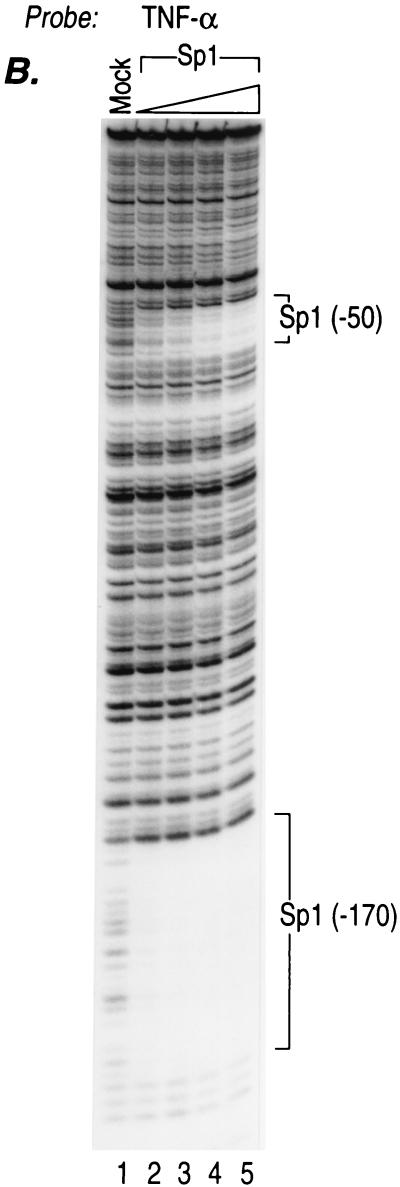
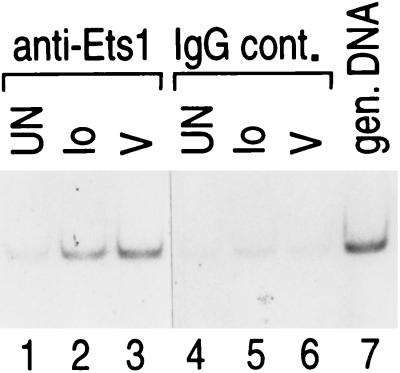
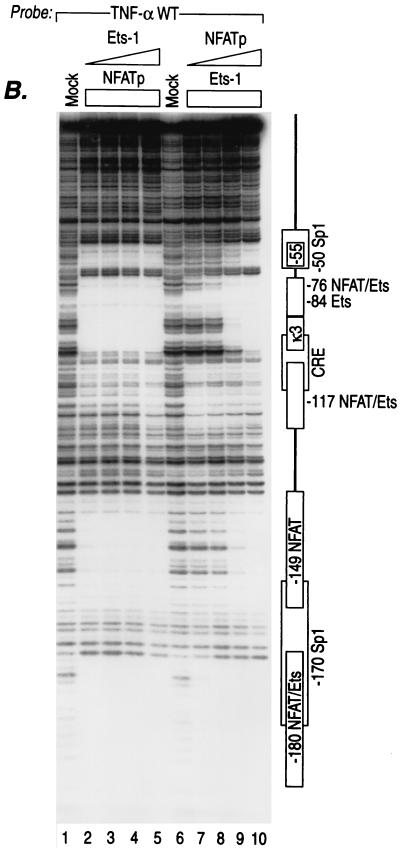
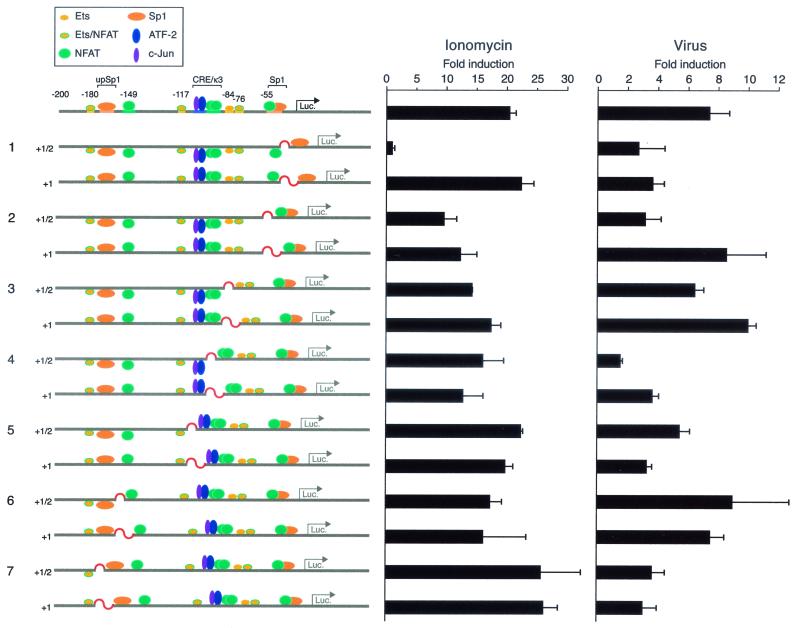
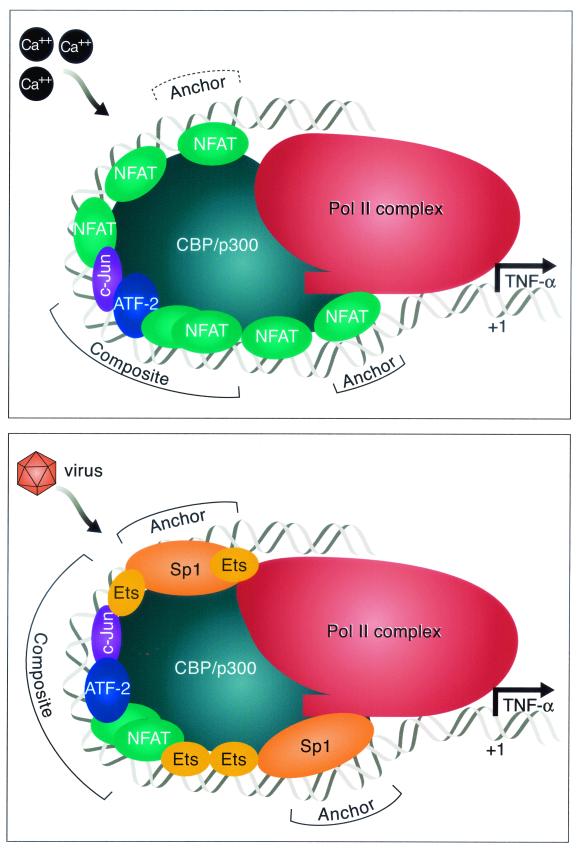
We present evidence that the inducer-specific regulation of the human tumor necrosis factor alpha (TNF-alpha) gene in T cells involves the assembly of distinct higher-order transcription enhancer complexes (enhanceosomes), which is dependent upon inducer-specific helical phasing relationships between transcription factor binding sites. While ATF-2, c-Jun, and the coactivator proteins CBP/p300 play a central role in TNF-alpha gene activation stimulated by virus infection or intracellular calcium flux, different sets of activators including NFATp, Sp1, and Ets/Elk are recruited to a shared set of transcription factor binding sites depending upon the particular stimulus. Thus, these studies demonstrate that the inducer-specific assembly of unique enhanceosomes is a general mechanism by which a single gene is controlled in response to different extracellular stimuli.


Figures

FIG. 1.
FIG. 1.
NFATp, Sp1, and Ets-1 bind to overlapping sites in the TNF-α promoter with different affinities. (A) NFATp binds to six sites and Sp1 binds to two sites in the human TNF-α promoter. The quantitative DNase I footprinting results using the wild-type (WT) human TNF-α promoter (nt −200 to +87 relative to the transcription start site) and increasing concentrations of recombinant NFATp (20 ng, 100 ng, 400 ng, and 2 μg) or Sp1 (0.01, 0.05, 0.25, and 1 footprinting unit [fpu]) (for information on footprinting units, see Promega product information on Sp1 [catalog no. E3391]) are shown. The increasing concentrations are represented in the figure by the height of the triangle over the lanes. The positions of the six NFATp-binding sites, two Sp1-binding sites, and the CRE site are indicated. (B) Sp1 binds to two sites in the TNF-α promoter with different affinities. The quantitative DNase I footprinting results using the wild-type human TNF-α promoter (nt −200 to +87 relative to the transcription start site) and increasing concentrations of recombinant Sp1 (0.5, 1, 2, and 3 fpu) are shown. Sp1 binds with high affinity to the −170 site and with low affinity to the −50 site, which are shown in the figure. (C) Ets-1 binds to the −84 Ets and the −76, −117, and −180 NFAT sites. The quantitative DNase I footprinting results using the wild-type human TNF-α promoter (nt −200 to +87 relative to the transcription start site) and increasing concentrations of recombinant NFATp or Ets-1 (20 ng, 100 ng, 400 ng, and 2 μg) are shown. The positions of the Ets-1, NFATp, Sp1, and CRE sites are indicated.
FIG. 1.
FIG. 1.
NFATp, Sp1, and Ets-1 bind to overlapping sites in the TNF-α promoter with different affinities. (A) NFATp binds to six sites and Sp1 binds to two sites in the human TNF-α promoter. The quantitative DNase I footprinting results using the wild-type (WT) human TNF-α promoter (nt −200 to +87 relative to the transcription start site) and increasing concentrations of recombinant NFATp (20 ng, 100 ng, 400 ng, and 2 μg) or Sp1 (0.01, 0.05, 0.25, and 1 footprinting unit [fpu]) (for information on footprinting units, see Promega product information on Sp1 [catalog no. E3391]) are shown. The increasing concentrations are represented in the figure by the height of the triangle over the lanes. The positions of the six NFATp-binding sites, two Sp1-binding sites, and the CRE site are indicated. (B) Sp1 binds to two sites in the TNF-α promoter with different affinities. The quantitative DNase I footprinting results using the wild-type human TNF-α promoter (nt −200 to +87 relative to the transcription start site) and increasing concentrations of recombinant Sp1 (0.5, 1, 2, and 3 fpu) are shown. Sp1 binds with high affinity to the −170 site and with low affinity to the −50 site, which are shown in the figure. (C) Ets-1 binds to the −84 Ets and the −76, −117, and −180 NFAT sites. The quantitative DNase I footprinting results using the wild-type human TNF-α promoter (nt −200 to +87 relative to the transcription start site) and increasing concentrations of recombinant NFATp or Ets-1 (20 ng, 100 ng, 400 ng, and 2 μg) are shown. The positions of the Ets-1, NFATp, Sp1, and CRE sites are indicated.
FIG. 2.
FIG. 2.
Identification of inducer-specific requirements of activator binding sites for the TNF-α promoter activity in response to ionophore and virus. (A) Sequence of the TNF-α promoter from −200 to −20 nt. Activator binding sites are boxed and colored, and sites that are capable of binding two activators contain two colors. The mutations (M's) tested in panel B are shown below the wild-type sequence. The TATA box is shown in a black box. (B) Relative activities of TNF-α-Luc fusion constructs containing mutations (M's) in activator binding sites in ionophore- and virus-stimulated 68-41 T cells. 68-41 T cells were transfected with 1 μg of the wild-type −200 TNF-α promoter-Luc reporter (WT) or with isogenic reporters containing the mutations in different activator binding sites as shown in panel A. A Renilla luciferase control plasmid (1 μg) was cotransfected in all cases. Cells were then stimulated with ionomycin or Sendai virus as described in Materials and Methods, and luciferase assays were performed and normalized to Renilla luciferase activity. The histograms show the results of four independent experiments. Error bars represent the standard errors of the mean.
FIG. 3.
FIG. 3.
Inducer-specific binding of Ets-1 to the endogenous TNF-α promoter. Formaldehyde cross-linking and chromatin immunoprecipitation of unstimulated (UN) and ionomycin-stimulated (Io)- or virus-stimulated (V) 68-41 T cells are shown. Following stimulation, the cells were treated with formaldehyde to cross-link endogenous protein and DNA. Samples of sonicated and purified chromatin were immunoprecipitated with the indicated antibodies, and DNA isolated from immunoprecipitated material was amplified by PCR with primers specific for the TNF-α gene. An increase in the relative amount of the amplified TNF-α promoter-specific PCR product indicates binding of the protein to the endogenous TNF-α promoter. To demonstrate that the efficiencies of cross-linking and immunoprecipitation of Ets-1 to the TNF-α promoter were equivalent in the mock-, virus-, and ionophore-treated samples, we included isotype-matched IgG antibodies (IgG control [IgG cont.]). gen., genomic.
FIG. 4.
FIG. 4.
Mutually exclusive binding of different activators to shared sites in the TNF-α promoter. (A) Mutually exclusive binding of NFATp and Sp1 to shared sites in the TNF-α promoter. DNase I footprinting results using the wild-type (WT) human TNF-α promoter (nt −200 to +87 relative to the transcription start site) or isogenic probes bearing mutations in the −50 Sp1 site (Sp1 mut or Sp1 cons mut), as described in the text, and increasing concentrations of recombinant NFATp and/or Sp1 are shown. The positions of the six NFAT-binding sites and two Sp1-binding sites are indicated to the left of the panel. (B) Mutually exclusive binding of NFATp and Ets-1 to shared sites in the TNF-α promoter. DNase I footprinting results using the wild-type human TNF-α promoter and increasing concentrations of either recombinant Ets-1 or NFATp are shown. The concentration of recombinant Ets-1 was increased, while NFATp protein was kept at a constant and maximal concentration (lanes 2 to 5), and vice versa: the concentration of recombinant NFATp was increased, while Ets-1 protein was kept at a constant and maximal concentration (lanes 7 to 10). The concentrations of recombinant proteins used are described in detail in the legend to Fig. 1.
FIG. 4.
FIG. 4.
Mutually exclusive binding of different activators to shared sites in the TNF-α promoter. (A) Mutually exclusive binding of NFATp and Sp1 to shared sites in the TNF-α promoter. DNase I footprinting results using the wild-type (WT) human TNF-α promoter (nt −200 to +87 relative to the transcription start site) or isogenic probes bearing mutations in the −50 Sp1 site (Sp1 mut or Sp1 cons mut), as described in the text, and increasing concentrations of recombinant NFATp and/or Sp1 are shown. The positions of the six NFAT-binding sites and two Sp1-binding sites are indicated to the left of the panel. (B) Mutually exclusive binding of NFATp and Ets-1 to shared sites in the TNF-α promoter. DNase I footprinting results using the wild-type human TNF-α promoter and increasing concentrations of either recombinant Ets-1 or NFATp are shown. The concentration of recombinant Ets-1 was increased, while NFATp protein was kept at a constant and maximal concentration (lanes 2 to 5), and vice versa: the concentration of recombinant NFATp was increased, while Ets-1 protein was kept at a constant and maximal concentration (lanes 7 to 10). The concentrations of recombinant proteins used are described in detail in the legend to Fig. 1.
FIG. 5.
FIG. 5.
Inducer-specific occupancy of the activator binding sites in the TNF-α promoter region. A model of the cis-acting TNF-α promoter elements and transcription factors involved in the inducer-specific regulation of TNF-α by ionophore and virus in T cells is summarized schematically. Activator binding sites that are critical for activation of the promoter are shown in colored boxes. The transcription factors that are recruited to the TNF-α promoter (NFAT, Sp1, Ets, and ATF-2/c-Jun) following the indicated stimuli are shown in different shapes and colors.
FIG. 6.
FIG. 6.
TNF-α gene activation requires inducer-specific precise helical phasing between activator binding sites. 68-41 T cells were transfected with the wild-type −200 TNF-α promoter-Luc reporter or with the indicated mutant reporter constructs containing insertions between activator binding sites that disrupt and restore helical phasing as indicated and with the Renilla luciferase (Luc.) control plasmid. After the cells were stimulated with ionomycin or Sendai virus, luciferase activity was measured and divided by Renilla luciferase activity to normalize transfection efficiency and fold induction was calculated. The histograms show the results of four independent experiments. Error bars represent the standard errors of the mean. Note that we observed a strong correlation between the effects of the insertion mutants on basal and induced levels of transcription (data not shown), consistent with the fact that both the basal transcription complex and enhanceosome contribute to the induction of the TNF-α gene.
FIG. 7.
FIG. 7.
Model of the recruitment of inducer-specific TNF-α gene enhanceosomes in T lymphocytes. Distinct enhanceosomes are formed on the TNF-α promoter region in response to ionophore or virus stimulation of T cells. The ionomycin-inducible enhanceosome includes proteins bound to the composite core element CRE/κ3 (ATF-2/c-Jun/NFATp dimer) and two NFAT molecules closest to the basic transcription complex, which we imagine play a major anchoring role in the process of forming the functional transcription-driving complex. We note that phasing mutations upstream of the −76 NFAT site have a relatively modest effect on transcriptional activation by ionomycin, although site-directed mutations in these sites do have a significant impact on gene induction (Fig. 2). The virus-inducible enhanceosome has different components. It has a composite core element ATF-2/c-Jun/NFATp dimer, which also includes Ets protein, and it contains two anchoring Sp1/Ets complexes that, we speculate, are responsible for the recruitment of basic transcription machinery and the activation of transcription. Once assembled, the enhanceosome makes multiple contacts with the basal transcription Pol II complex. The relative sizes of the proteins and the length of the DNA covered are not drawn to scale.

References

    1. Arias, J., A. S. Alberts, P. Brindle, F. X. Claret, T. Smeal, M. Karin, J. Feramisco, and M. Montminy. 1994. Activation of cAMP and mitogen responsive genes relies on a common nuclear factor. Nature 370:226-229. - PubMed
    1. Bassuk, A. G., and J. M. Leiden. 1995. A direct physical association between ETS and AP-1 transcription factors in normal human T cells. Immunity 3:223-237. - PubMed
    1. Billon, N., D. Carlisi, M. B. Datto, L. A. van Grunsven, A. Watt, X.-F. Wang, and B. B. Rudkin. 1999. Cooperation of Sp1 and p300 in the induction of the CDK inhibitor p21WAF1/CIP1 during NGF-mediated neuronal differentiation. Oncogene 18:2872-2882. - PubMed
    1. Block, K. L., Y. Shou, and M. Poncz. 1996. An Ets/Sp1 interaction in the 5′-flanking region of the megakaryocyte-specific alpha IIb gene appears to stabilize Sp1 binding and is essential for expression of this TATA-less gene. Blood 88:2071-2080. - PubMed
    1. Brinkman, B. M., J. B. Telliez, A. R. Schievella, L. L. Lin, and A. E. Goldfeld. 1999. Engagement of tumor necrosis factor (TNF) receptor 1 leads to ATF-2- and p38 mitogen-activated protein kinase-dependent TNF-alpha gene expression. J. Biol. Chem. 274:30882-30886. - PubMed

Publication types

MeSH terms

LinkOut - more resources